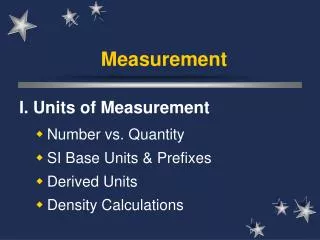
Understanding International System of Measurement (SI) Units
200 likes | 298 Vues
Learn about SI measurement prefixes, common units, equipment, precision, accuracy, and resolution. Discover significant digits, graphing tips, and types of graphs for effective data representation.

Understanding International System of Measurement (SI) Units
E N D
Presentation Transcript
International System of Measurement (SI) • SI units form a base-10 or decimal system. kilo….hecto….deka….BASE….deci….centi….milli 1000 100 10 1 0.1 0.01 0.001 meter gram liter example: 6,532,492cm => ?km 65.32492km example: 0.00032kg => ?g 0.32g
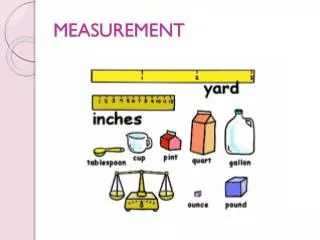
Measurement Common units of measurements and equipment to use-- • Mass: g, kg • Use balance or scale • Distance: mm, cm, m, km • Use ruler or meter stick • Volume: ml, L, cm3 • Use graduated cylinder • Temperature: ºC, ºF, Kelvin • Use thermometer • Time: seconds, minutes, hours….. • Use stop watch = most common
Precision, Accuracy, and Resolution • Precision • describes how close together repeated measurements or events are to one another-- even if it is wrong • Accuracy • how close the measurement is to the correct answer • Resolution • the smallest amount that can be measured
Significant digits (figures) • are the meaning full digits in a measurement • meaningful the numbers the equipment can measure AND one more that you estimate
best answer is around 2.63 cm • to a scientist this number means “between 2.60 and 2.70 cm.” • the last digit, 3, representing the smallest amount, is uncertain, but it is still significant • always “push it” one more decimal place by estimating
Graphing “MIXES TUL” • M: maximize your graph (use all of the graph paper) • IX: Independent variable on X-axis (dependent variable on y-axis) • ES: Equally Spaced scale increments (start at 0) • T: Title (descriptive and mentions the y-variable vs. x-variable) • UL: Units and Labels on both axes
Types of Graphs • Line or scatterplot graphs • can help determine if two variables are related • can connect the dots or sometimes draw a line of best fit
Bar Graphs • used when you want to compare different data such as objects or events
Pie Graphs • show the amount each part makes of up of the whole (100%).