Array Design & Glider Routing for Effective Oceanography Surveys
Explore cutting-edge techniques for array design and glider routing to enhance oceanographic surveys. Discover methods for optimizing mapping skills, fast routes in steady currents, and maximizing glider performance. Dive into field studies to evaluate sensor performance and refine control algorithms.

Array Design & Glider Routing for Effective Oceanography Surveys
E N D
Presentation Transcript
Spray Activities for ASAP Scripps Institution of Oceanography Russ Davis Jeff Sherman Jim Dufour Brent Jones 1. Array design and glider routing 2. Field operations and new technical developments 3. Science - define scales – map measured velocity the role of surface layer and eddies in upwelling evaluate glider control strategies
Array Design & Routing 1. A derivative from Snell’s Law provides most rapid path through known steady current between points A and B General rule: In an adverse or perpendicular currents, go directly across the current. In weak or favorable currents head toward target. 2. A simple modified “current bucking” algorithm keeps gliders near prescribed track General rule: Staying close to the track slows progress and can destroy mapping skill 3. Direct optimization of an array’s mapping skill leads to complex patterns of data distribution not suitable for human analysis 4. Direct optimization of mapping skill along “ideal tracks” provides a usable basis for automatic steering and inter-vehicle coordination
Fast Routes In Steady Current Minimum travel time is found is found from first variation as Snell’s Law derives from Fermat’s Principle. Dark lines are fastest paths from y=0 through current shown in red. Light lines are second fastest extremum of travel time. This is analogous to the multiple “rays” found from Snell’s Law.
Staying On Assigned Track U L Head toward “steering point” (red diamond) using current compensation. Used during much of MB2006.Works poorly when vehicle is far from track.
Steering To Maximize Skill As each glider surfaces, it is given the heading that maximizes mapping skill upon arrival. Avoids vehicle bunching on field correlation scale. Tuning with an attractor to the track keeps gliders near their ideal paths as they approach/pass each other. Yields only a local optimum. Doubles back
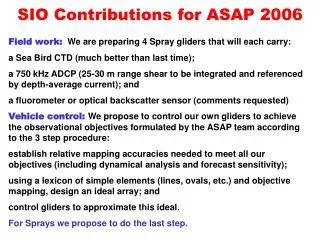
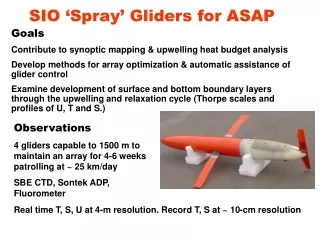
Field Studies 1. One Spray constructed. Four prepared with CTD (pumped), Chlorophyll-a fluorometer, and 750 kHz ADCP ( ~ 25 m range) 2. Four units deployed near Moss Landing July 18-20 and recovered September 2 without interruption. 3. All sensors performed nominally. Measured 4527 profiles of T, S, fluorescence, acoustic backscatter and directly-measured velocity. 4. Optics and CTD that use pumped system were unaffected by biofouling that reduced the speed of one unit to a dangerous level 5. Sprays focused sampling on perimeter of control volume where ADCP add significantly to flux measurements 6. Limitations to controlling sampling were not strategy but inability to overcome 25 cm/s vertically averaged currents
Array Performance Figure shows array perimeter and typical station spacing. Sections between red marks were patrolled by oscillating “rocker” Spray 1. Find objective-mapping skill if vehicles move in perfect synchronism. 2. Compare with actual skill
Skill vs. perimeter distance at various times in a cycle of four perfectly synchronized vehicles advancing at 25 cm/s South-East North-East 3. Array at peak behavior 2. Array begins to recover 1. Strong poleward current thwarts coordination 4. Allocation to interior ideal paths to replace Slocums degrades array performance
Plans For Analysis • 1. Extend AOSN scale analysis to better-measured ASAP array. Explore dependence of scale on upwelling/relaxation regimes • Use scale analysis with all ADP, ADCP and geostrophic shear data to generate 3-D maps of measured velocity including surface layer • Evaluate control algorithms by re-running gliders in reconstructed velocity field • Analyze magnitude and role of surface-layer transport in the heat budget and its relation to Ekman layer and model surface layers • Compare observed surface layer characteristics (T, S and velocity) with model characteristics. • Establish role of eddy-associated “squirts” in the heat and mass budgets of upwelling • 7. Participate in model-data comparisons