Download
1 / 97
1.02k likes | 1.7k Vues
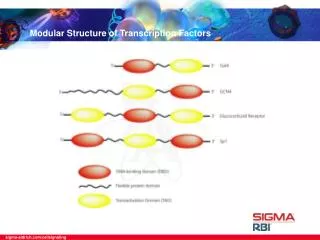
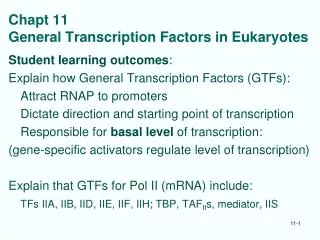
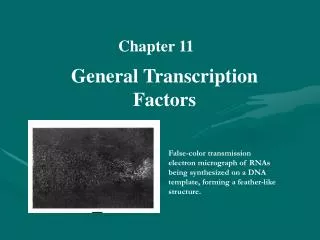
Chapter 11. General Transcription Factors. False-color transmission electron micrograph of RNAs being synthesized on a DNA template, forming a feather-like structure. Table of contents. Class II Factors Class I Factors UBF Class III Factors. 11.1 Class II Factors.

E N D
Chapter 11 General Transcription Factors False-color transmission electron micrograph of RNAs being synthesized on a DNA template, forming a feather-like structure.
Table of contents • Class II Factors • Class I Factors • UBF • Class III Factors
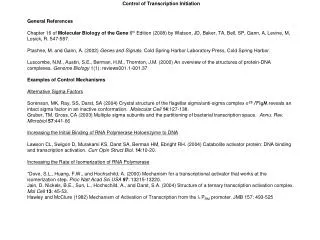
11.1 Class II Factors • The class II preinitiation complex • Structure and function of TFIID • Structure and function of TFIIA and TFIIB • Structure and function of TFIIF • Structure and function of TFIIE and TFIIH • Elongation Factors • The polymerase II holoenzyme
11.1.1 The class II preinitiation complex • The general transcription factors combine with RNA polymerase to form a preinitiation complex; • Six general transcription factors named TFIIA, TFIIB, TFIID, TFIIE, TFIIF, and TFIIH; • The factors and poly II bind in a specific order to growing preinitiation complex.
Formation of a complex involving TFIID,TFIIA,and a promoter-bearing DNA Figure 11.1 Formation of a complex involving TFIID, TFIIA, and a promoter-bearing DNA. Sharp and coworkers mixed a labeled DNA fragment containing the adenovirus major late promoter with TFIIA and TFIID separately and together, then electrophoresed the products. Lane A, with DNA and TFIIA alone, showed only free DNA, which migrated rapidly, almost to the bottom of the gel. Lane D, with DNA and TFIID alone, showed free DNA plus a non-specific complex (NS). Lane A+D, with both transcription factors, showed a larger complex with both factors (A+D, later named DA).
DNase footprinting the DA complex Figure 11.2 DNase footprinting the DA complex. Sharp and colleagues performed DNase footprinting with TFIIA, TFIID, and a labeled fragment of DNA containing a TATA box. Lanes 1 and 2 contained sequencing ladders (G+A and G, respectively) obtained by Maxam-Gilbert sequencing of the same DNA fragment. Lane 3 (also denoted F, for "free DNA") was a control with DNA but with no protein added. Lane 4 contained DNA plus TFIID, which presumably formed a non-specific complex (NS). Lane 5 contained DNA plus TFIID and TFIIA (A+D). The footprint in lane 5, indicated with a bracket at right, encompasses the TATA box, which is centered around position -25. The arrow at the top of the bracket denotes a site of enhanced DNase sensitivity adjacent to the protected region.
Building the preinitiation complex Figure 11.3 Building the preinitiation complex.
Figure 11.3 Building the preinitiation complex. (a) the DABPolFcomplex.Reinberg and colleagues performed gel mobility shift assays with TFIID, A, B, and F, and RNA polymerase II, along with labeled DNA containing the adenovirus major late promoter Lane 1 shows the familiar DA complex, formed with TFIID and A Lane 2 demonstrates that adding TFIIB caused a new complex, DAB, to form Lane 3 contained TFIID, A, B, and F, but it looks identical to lane 2. Thus, TFIlF did not seem to bind in the absence of polymerase II Lanes 4-7 show what happened when the invesbgators added more and more polymerase II in addibon to the four transcription factors: More and more of the large complexes, DABPolF and DBPolF, appeared. Lanes 8-11 contained less and less TFIIF, and we see less and less of the large complexes. Finally, lane 12 shows that essentially no DABPolF or DBPolF complexes formed when TFIIF was absent, Thus, TFIIF appears to bring polymerase II to the complex. The lanes on the right show what happened when Reinberg and colleagues left out one factor at a time. In lane 13, without TFIID, no complexes formed at all Lane 14 shows that the DA complex, but no tubers, formed in the absence of TFIIB Lane 15 demonstrates that DBPolF could still develop without TFIIA. Finally, all the large complexes appeared in the presence of all the factors (lane 16). (b) The DBPolFEHJAcomplex Reinberg and colleagues started with the DBPolF complex (lacking TFIIA, lane 1 ) assembled on a labeled DNA containing the adenovirus major late prommer Next, they added TFIIE, then TFIIH, then TFIIJ, then TFIIA, in turn, and performed gel mobility shift assays. With each new transcription factor, the complex grew larger and its mobility decreased further. The mobilities of all the complexes are indicated at right. Lanes 5 -7 show the result of adding more and more TFIIA to the DBPolFEHJ complex, but most of the DBPolFEHJA complex had already formed, even at the lowest TFIIA concentration Lanes 8 -11 show again the resud of leaving out radons factors, denoted at the top of each lane At best, only the DB complex forms At worst, in the absence of TFIID, no complex at all forms.
Footprinting the DA and DAB complexes Figure 11.4 Footprinting the DA and DAB complexes. Reinberg and coworkers performed fooprinting on the DA and DAB complexes with both DNase and another DNA strand breaker: a 1 ,10 phenanthroline-copper ion complex (OP-Cu+). (a) Footprinting on the nontemplate strand. The DA and DAB complexes formed right over the TATA box (TATAAA, indicated at right, top to besom) (b) Footgrinting on the template strand. Again, the protected region in beth the DA and DAB complexes was centered on the TATA box (TATAAA, indicated at right, bottom to top) The arrow near the top at right denotes a site of enhanced DNA cleavage at position +10.
Footprinting the DABPolF complex Figure 11.5 Footprinting the DABPolF complex. Reinberg and colleagues performed DNase footprinting with TFIID, A, and B (lane 2) and with TFIID, A, B, and F, and RNA polymerase II (lane 3). When RNA polymerase and TFIIF joined the complex, they caused a huge extension of the footprint, to about position +17. This is consistent with the large size of RNA polymerase II
Model for formation of the DABPolF complex Figure 11.6 Model for formation of the DABPolF complex. TFIIF (green) binds to polymerase II (Pol II, red) and carries it to the DAB complex. The result is the DABPolF complex. This model conveys the conclusion that polymerase II extends the DAB footprint in the downstream direction, and therefore binds to DNA downstream of the binding site for TFIID, A, and B, which centers on the TATA box.
11.1.2 Structure and Function of TFIID • TATA Box binding Protein (TBP) • TBP-associated factors(TAF)
Figure 11.8 Methylation interference at the TATA box. Roeder and colleagues end-labeled DNA containing the adenovirus major late promoter on either the template (a) or nontemplate strand (b), then methylated the DNA under conditions in which As were preferentially methylated. Then they added TFIID and filtered the protein-DNA complexes. DNAs that could still bind TFIID were retained, while free DNA flowed through. Finally, they cleaved the filter-bound and free DNAs at methylated sites with NaOH and subjected the fragments to gel electrophoresis. The autoradiographs in (a) and (b) show that the bound DNA did not cleave in the TATA box, so it was not methylated there. On the other hand, the free DNA was cleaved in the TATA box, showing that it had been methylated there. That is why it no longer bound TFIID. (c) Summary of methylated bases in the free DNA fractions. The lengths of the bars show the intensities of the bands in the "free" lanes in parts (a) and (b), which indicate the degree of methylation. Most of the methylation occurred on As, rather than Gs. These methyl groups are in the minor groove; since this methylated DNA was incapable of binding TFIID, these results suggest that TFItD binds in the minor groove. In reading the sequences in this and the next figure, remember that the nontemplate strand contains the TATA sequence.
Effect of substituting dU for dT on TFIID binding to the TATA box Figure 11.9 Effect of substituting dU for dT on TFIID binding to the TATA box.
Figure 11.9 Effect of substituting dU for dT on TFIID binding to the TATA box. Roeder and coworkers bound TWIID to labeled DNA containing TATA boxes with the sequences given at top. They did the binding in the presence of excess unlabeled competitor DNA containing either wild-type or mutant TATA boxes (mutant sequence: TAGAGAA). To assay for TFIID-TATA box binding, they electrophoresed the protein-DNA complexes under non-denaturing conditions which separate free DNA from protein-bound DNA. In all cases, the wild-type TATA box was able to compete, so only free DNA was observed (even-numbered lanes). However, in all cases, the mutant TATA box was unable to compete, even when the labeled TATA box contained a dU instead of a dT. In fact, lane 7 shows that substitution of a dU for a dT in position 2 of the template strand of the TATA box (sequence: AdUATTTT) actually seemed to enhance TFIID-TATA box binding compared to the unsubstitued TATA box (lane 1 ). Since dU and dT differ in the major groove, but not the minor groove, and the substitution of dU for dT did not inhibit binding, this suggests that TFIID binds in the minor groove.
Effect of substituting C for T and I for A on TFIID binding to the TATA box Figure 11.10 Effect of substituting C for T and I for A on TFIlD binding to the TATA box.
Figure 11.10 Effect of substituting C for T and I for A on TFIlD binding to the TATA box. (a) Appearance of nueleosides as viewed from the major and minor grooves. Notice that thymine and cytidine look identical from the minor groove (green, below), but quite different from the major groove (red, above) Similarly. adenosine and inosine look the same from the minor groove, but very different from the major groove. (b)Sequence of the adenovirus major late promoter (MLP) TATA box with Cs substituted for Ts and Is substituted for AS, yielding a CICI box . (c) Binding TBP to the CICI box. Start and Hawley performed gel mobility shift assays using DNA fragments containing the MLP with a CICI box (lanes 1-3) or the normal TATA box (lanes 4-6), or a non-specific DNA (NS) with no promoter elements (lanes 7-9) The first lane in each set (1,4, and 7) contained yeast TBP; the second lane in each set (2, 5, and 8) contained human TSP; and the third lane in each set contained just buffer The yeast and human TBPs gave rise to slightly different size brotein-DNA comple~es, but substituting a CICI box for the TATA box had little effect on the yield of the complexes. Thus, TBP binding to the TATA box was not significantly diminished by the substitutions.
Figure 11.6 Structure of the TBP-TATA box complex. This diagram, based on Sigler and colleagues' crystal structure of the TBP-TATA box complex, shows the backbone of the TBP in olive at top. The long axis of the "saddle" is in the plane of the page. The DNA below the protein is in multiple colors. The backbones in the region that interacts with the protein are in orange, with the base pairs in red. Notice how the protein has opened up the narrow groove and almost straightened the helical twist in that region. One stirrup of the TBP is seen as an olive loop at right center, inserting into the minor groove. The other stirrup performs the same function, but it is out of view in back of the DNA. The two ends of the DNA, which do not interact with the TBP, are in blue and gray: blue for the backbones, and gray for the base pairs. The left end of the DNA sticks about 25 degrees out of the plane of the page, and the right end points inward by the same angle. The overall bend of about 80 degrees in the DNA, caused by TBP, is also apparent.
Figure 11.7 Effects of mutations in TBP on transcription by all three RNA polymerases.
Figure 11.7 Effects of mutations in TBP on transcription by all three RNA polymerases. • Locations of the mutations. The boxed region indicates the conserved C-terminal domain of the TBP; red areas denote two repeated elements involved in DNA binding. The two mutations are: P65 →S, in which proline 65 is changed to a serine; and 1143 → N, in which isoleucine 143 is changed to asparagine. (b-e) Effects of the mutations. Reeder and Hahn made extracts from wild-type or mutant yeasts, as indicated at bottom, and either heat-shocked them at 37 ℃or left them at 24℃, again as indicated at bottom. Then they tested these extracts by S1 analysis for ability to start transcription at promoters recognized by all three nuclear RNA polymerases: • The rRNA promoter (polymerase I); (c) the CYC1 (polymerase II) promoter; (d) the 5S rRNA promoter (polymerase III); and (e) the tRNA promoter (also polymerase III). The 1143 →N extract was deficient in transcribing from all four promoters even when not heat-shocked. The P65 →S extract was deficient in transcribing from polymerase II and III promoters, but could recognize the polymerase promoter, even after heat shock.
SUMMARY TFIID contains a 38 kDa TATA box-binding protein (TBP) plus several other polypeptides known as TBP-associated factors (TAFIIs). The C-terminal 180 amino acid fragment of the human TBP is the TATA box-binding domain. The interaction between a TBP and a TATA box is an unusual one that takes place in the DNA minor groove. The saddle-shaped TBP lines up with the DNA, and the under-side of the saddle forces open the minor groove and bends the TATA box into an 80°curve.
Structure of a Drosophila TFIID assembled in vitro from the products of cloned genes
Relationships among the TAFs of fruit flies,humans,and yeast Figure 11.13 relationships among the TAFs of fruit flies (D.melanogaster), humans (H. sapiens), and yeast (S. cerevisiae). The horizontal lines link homologous proteins.
Activities of TBF and TFIID on four different promoters Figure 11.14 Activities of TBP and TFIID on four different promoters. Tjian and colleagues tested a reconstituted Drosophila transcription system containing either TBP or TFIID (indicated at top) or templates bearing four different promoters (also as indicated at top). The promoters were of two types diagrammed at bottom: The first type, represented by the adenovirus E1B and E4 promoters, contained a TATA box (red). The second type, represented by the adenovirus major late promoter (AdML) and the Drosophila Hsp70 promoter, contained a TATA box plus an initiator (I, green) and a downstream element (D, blue). After transcription in vitro, Tjian and coworkers assayed the RNA products by primer extension (top). The autoradiographs show that TBF and TFIID fostered transcription equally well from the first type of promoter (TATA box only), but that TFIID worked much better than TBP in supporting transcription from the second type of promoter (TATA box plus initiator plus downstream element).
Identifying the TAFIIs that bind to the hsp70 promoter Figure 11.15 Identifying the TAFIIs that bind to the hsp70 promoter. Tjian and colleagues photo-crosslinked TFIID to a 32p-labeled template containing the hsp70 promoter. This template had also been substituted with the photo-sensitive nucleoside bromodeoxyuridine (BrdU). Next, these workers irradiated the TFIID-DNA complex with ultraviolet (UV) light to form covalent bonds between the DNA and any proteins in close contact with the major groove of the DNA. Next, they digested the DNA with nuclease and subjected the proteins to SDS-PAGE. Lane 1 of the autoradiograph shows the results when TFIID was the input protein. TAFII250 and TAFII150 became labeled, implying that these two proteins had been in close contact with the labeled DNA's major groove. Lane 2 is a control with no TFIID. Lane 3 shows the results when a ternary complex containing TBP, TAFII250, and TAFII150 was the input protein. Again, the two TAFIIs became labeled, suggesting that they bound to the DNA. Lane 4 shows the results when TBP was the input protein. It did not become labeled, which was expected since it does not bind in the DNA major groove.
DNase I footprinting the hsp70 promoter with TBP and the ternary complex Figure 11.16 DNase I footprinting the hsp70 promoter with TBP and the ternary complex (TBP, TAFII250, and TAFII150). Lane 1, no protein; lane 2, TBP; lane 3, ternary complex. In both lanes 2 and 3, TFIIA was also added to stabilize the DNA-protein complexes, but separate experiments indicated that it did not affect the extent of the footprints. Lane 4 is a Maxam-Gilbert G+A sequencing lane used as a marker. The extents of the footprints caused by TBP and the ternary complex are indicated by brackets at left. The locations of the TATA box and initiator are indicated by boxes at right.
Model for the interaction between TBP and TATA-containing or TATA-less promoters
Failure of TBP alone to respond to Sp1 Figure 11.18 Failure of TBP alone to respond to Sp1. (a) Structure of the test promoter. This is a composite Sp1-responsive promoter containing six GC boxes (red) from the SV40 early promoter and the TATA box (blue) and transcription start site (initiator, green) from the adenovirus major late promoter. Accurate initiation from this promoter in the run-off assay described below should produce a 375 nt transcript. (b) In vitro transcription assay. Tjian and colleagues mixed TFIID, or bhTBP, or vhTBP, as shown at top, with TFIIA, TFIIB, TFIIE, TFIIF, and RNA polymerase II, then performed a run-off transcription assay with [α- 32p] UTP. Lanes 1 and 2 show that natural TFIID supported a high level of transcription from this promoter, and this transcription was significantly enhanced by the transcription factor Sp1. Lanes 3-6 demonstrate that any transcription due to recombinant human TBP was not stimulated by Sp1 in the absence of TAFIIs.
Activation by Sp1 requires TAFII110 Figure 11.19 Activation by Sp1 requires TAFII110. Tjian and colleagues used a primer extension assay to measure transcription from a template containing a TATA box and three upstream GC boxes. They used either a Drosophlia cell extract (a) or a human cell extract (b), each of which had been depleted of TFIID. They replaced the missing TFIID with any of the three different complexes, picture at bottom, containing combinations of TBP, TAFII250, and TAFII110. They also added no Sp1 (-), or two increasing concentrations of Sp1, represented by the wedges. The autoradiographs show the amount of transcription, and therefore the activation achieved by Sp1 with each set of TAFIIs. Activation was observed in each extract only with all three TAFIIs.
A model for transcription enhancement by activators Figure 11.20 A model for transcription enhancement by activators. (a) TAFII250 does not interact with either Sp1 or Gal4-NTF-1 (a hybrid activator with the transcription-activating domain of NTF-1), so no activation takes place. (b) Gal4-NTF-1 can interact with either TAFII150 or TAFII60 and activate transcription; Sp1 cannot interact with either of these TAFs or with TAFII250 and does not activate transcription. (c) Gal4-NTF-1 interacts with TAFII150 and Sp1 interacts with TAFII110,so both factors activate transcription. (d) Holo TFIID contains the complete assortment of TAFIIs, so it can respond to a wide variety of activators, represented here by Sp1, Gal4-NTF-1, and a generic activator at top.
Whole genome analysis of transcription requirements in yeast
Figure 11.18 Three-dimensional models of TFIID and TFTC. Schultz and colleagues made negatively stained electron micrographs (see Chapter 19, for method) of TFIID and TFTC, then digitally combined images to arrive at an average. Then they tilted the grid in the microscope and analyzed the resulting micrographs to glean three-dimensional information for both proteins. The resulting models for TFIID (green) and TFTC (blue) are shown.
SUMMARY TFIID contains at least eight TAFIIs, in addition to TBP. Most of these TAFIIs are evolutionarily conserved in the eukaryotes. The TAFIIs serves several functions, but two obvious ones are interacting with core promoter elements and interacting with gene-specific transcription factors. TAFII250 and TAFII150 help TFIID bind to the initiator and downstream elements of promoters and therefore can enable TBP to bind to TATA-less promoter that contain such elements. TAFII250 and TAFII110 help THIID interact with Sp1 that is bound to GC boxes upstream of the transcription start site. These TAFIIs therefore ensure that TBP can bind to TATA-less promoters that have GC boxes. Different combinations of TAFIIs are apparently required to respond to various transcription activators, at least in higher eukaryotes. TAFII250 also has two enzymatic activities. It is a histone acetyl trans
11.1.3 Structure and function of TFIIA and TFIIB • TFIIA: 2-3 subunits, binds to TBP and stabilizes binding between TFIID and promoters; • TFIIB: a linker between TFIID and TFIIF/polymerase
Hypothetical structure of a TFIIA-TFIIB-TBP-TATA box complex Figure 11.19 Hypothetical structure of a TFIIA-TFIIB-TBP-TATA box complex. This is a combination of two structures: a human core TFIIB-plant TBP-adenovirus TATA box structure, and a yeast TFIIA-TBP-TATA box structure. None of the proteins is complete. They are all core regions that have the key elements needed to do their jobs. The DNA is gray; the two halves of core TBP are light blue (upstream half) and dark blue (downstream half); the amino terminal domain of core TFIIB is red and the carboxyl terminal domain is magenta; the core large subunit of TFIIA is green, and the small subunit is yellow. The transcription start site is at right, denoted "+1 ."
SUMMARY THIIA contains two subunits (yeast), or three subunits (fruit flies and humans). This factor is probably more properly considered a TAFII since it binds to TBP and stabilizes binding between TFIID and promoters. TFIIB serves as a linker between TFIID and TFFIIF/ polymerase II. It has two domains, one of which is responsible for binding to TFIID, the other for continuing the assembly of the preinitiation complex. A structure for the TFIIA-TFIIB-TBP-TATA box complex can be imagined, based on the known structures of the TFIIA-TBP-TATA box and TFIIB-TBP-TATA box complexes. This structure shows TFIIA and TFIIB binding to the upstream and downstream stirrups, respectively, of TBP. This puts these two factors in advantageous positions to perform their functions.
11.1.4 Structure and function of TFIIF Binding of the polymerase to the DAB complex requires prior interaction with TFIIF, composed of two polypeptides called RAP30 and RAP70. RAP30 is the protein that ushers polymerase into the growing complex.
Role of TFIIF in binding RNA polymerase II to the preinitiation complex Figure 11.22 Role of TFIIF in binding RNA polymerase II to the preinitiation complex.
Figure 11.22 Role of TFIIF in binding RNA polymerase II to the preinitiation complex. Greenblatt, Reinberg, and colleagues performed phenyl-Superose micro column chromatography on TFIIF and tested fractions for (a) TFIIF transcription factor activity; (b) preinitiation complex formation with RNA polymerase II, using a gel mobility shift assay; and (c) content of RAP30, detected by Western blotting and probing with an anti-RAP30 antibody. (a) TFIIF activity assay. Lane I, activity of the protein loaded onto the column (input); lane +, positive control with known TFIIF activity; other lanes are numbered according to their order of elution from the column. The great majority of the TFIIF activity eluted in fractions 16-22. (b) Gel mobility shift assay. The lanes on the left show the complexes formed with the TFIIF input fraction alone (I), and with various combinations of highly purified TFIID, A, B, polymerase II, and TFIIF. The numbered lanes show the shifts in the DAB complex produced by addition of polymerase II plus the same column fractions as in part (a). The ability to form the DABPolF complex resided in the same fractions with TFIIF activity (16-22). (c) Western blot to detect RAP30. The labeling of the lanes has the same meaning as in panel (a). The fractions with RAP30 (16-22) were the same ones with TFIIF activity and the ability to bring polymerase II into the preinitiation complex. Thus, RAP30 seems to have this activity.
Formation of the DABPoIFE complex Figure 11.23 Formation of the DABPolFE complex.
Figure 11.23 Formation of the DABPolFE complex. Tjian, Reinberg, and colleagues performed gel mobility shift assays with various combinations of transcription factors, polymerase II, and a DNA fragment containing the adenovirus major late promoter. The protein components in each lane are given at top, and the complexes formed are indicated at left. Note that TFIID, A, B, F, E, and polymerase II formed the DABPolFE complex, as expected (lane 4). Lanes 5-8 show that increasing quantities of the two subunits of TFIIE, added separately, cannot join the DABPolF complex. However, lanes 9 and 10 demonstrate that the two polypeptides can join the complex if they are added together. Lane 11 is a repeat of lane 10, and lane 12 is identical except that it is missing TFIID. This is a reminder that everything depends on TFIID, even with all the other factors present.
Dependence of transcription on both subunits of TFIIE Figure 11.24 Dependence of transcription on both subunits of TFIIE.
Figure 11.24 Dependence of transcription on both subunits of TFIIE. (a) Tjian and Reinberg performed run-off transcription of a DNA fragment containing the adenovirus major late promoter in the presence of all transcription factors except TFIIE. They added whole TFIIE or the products of cloned genes encoding the subunits of the transcription factor in increasing concentration, as indicated at top. The wedge shapes illustrate the increase in concentration of each factor from one lane to another. Lanes 1 and 2 show that native TFIIE can reconstitute transcription activity. However, the subunits added separately cannot do this, as portrayed in lanes 3-10. On the other hand, the two subunits together can stimulate transcription. (b) The same kind of run-off assays, using the TATA-less G61 promoter, showed that the TFIIE produced by cloned genes stimulates Sp1-dependent transcription. Lanes 1 and 2 contained native TFIIE purified from HeLa cells. Lanes 3 and 4 contained TFIIE subunits produced by cloned genes. Lanes 5 and 6 had no TFIIE. Clearly, TFIIE is necessary, and the factor made by cloned genes works as well as the native one. Also, as we have seen before, transcription of the TATA-less promoter requires Sp1.
The preinitiation complex envisioned by Tjian and Reinberg Figure 11.25 The preinitiation complex envisioned by Tjian and Reinberg. This construct contains air of the factors in the DABPolFE complex plus TFIIH (orange), another general transcription factor we shall discuss next.
Phosphorylation of preinitiation complexes Figure 11.26 Phosphorylation of preinitiation complexes. Reinberg and colleagues performed gel mobility shift assays with preinitiation complexes DAB through DABPolFEH, in the presence and absence of ATP, as indicated at top Only when TFIIH was present did ATP shift the mobility of the complex (compare lanes 7 and 8). The simplest explanation is that TFIIH promotes phosphorylation of the input polymerase (polymerase IIA) to polymerase IIO.
TFIIH phosphorylates RNA polymerase II Figure 11.21 TFIIH phosphorylates RNA polymerase II.