Download
1 / 1
10 likes | 148 Vues
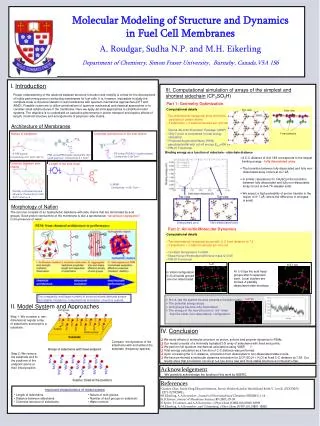
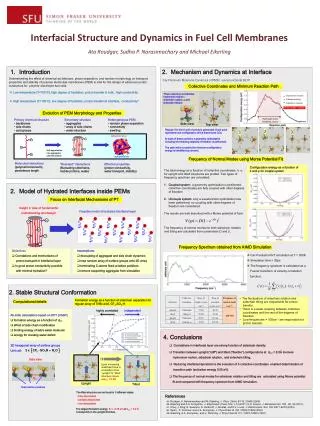
Interfacial Structure and Dynamics in Fuel Cell Membranes Ata Roudgar , Sudha P. Narasimachary and Michael Eikerling. 1. Introduction. 2. Mechanism and Dynamics at Interface.

E N D
Interfacial Structure and Dynamics in Fuel Cell Membranes Ata Roudgar, Sudha P. Narasimachary and Michael Eikerling 1. Introduction 2. Mechanism and Dynamics at Interface Understanding the effect of chemical architecture, phase separation, and random morphology on transport properties and stability of polymer electrolyte membranes (PEM) is vital for the design of advanced proton conductors for polymer electrolyte fuel cells. Car-Parrinello Molecular Dynamics (CPMD) using functional BLYP Collective Coordinates and Minimum Reaction Path • Low temperature (T<100˚C), high degree of hydration, proton transfer in bulk, high conductivity Three collective coordinates: hydronium motion r, sidechain rotation j and sidechain tilting q. • High temperature (T>100˚C), low degree of hydration, proton transfer at interface, conductivity? Barrier energy = 0.55eV r Evolution of PEM Morphology and Properties q j Hydrogen bond breaking occurs Side view Top view Regular 10x10x10 grid of points is generated. Each point represents one configuration of the these three CCs. At each of these positions a geometry optimization including all remaining degrees of freedom is performed. The path which contains the minimum configuration energy is identified (as shown). 2 1 3 Hydronium motion Sidechain tilting Sidechain rotating Frequency of Normal Modes using Morse Potential Fit Configuration energy as a function of q and j for couple system • The total energy as a function of collective coordinates, q, j for upright and tilted structures are plotted. Two types of frequency spectrum are calculated: • Coupled system: a geometry optimization is performed, collective coordinates are fully coupled with other degrees of freedom • Uncouple system: only a wavefunction optimization has been performed, no coupling with other degrees of freedom are considered • The results are well described with a Morse potential of form • The frequency of normal modes for both sidechain rotation and tilting are calculated from parameters D and b. • Primary chemical structure • backbones • side chains • acid groups • Secondary structure • aggregates • array of side chains • water structure • Heterogeneous PEM • random phase separation • connectivity • swelling 2. Model of Hydrated Interfaces inside PEMs Focus on Interfacial Mechanisms of PT hydrophobic phase Insight in view of fundamental understanding and design: Feasible model of hydrated interfacial layer Self-organization into aggregates and dissociation hydrophilic phase Molecular interactions (polymer/ion/solvent), persistence length “Rescaled” interactions (fluctuating sidechains, mobile protons, water) Effective properties (proton conductivity, water transport, stability) Frequency Spectrum obtained from AIMD Simulation Objectives • Correlations and mechanisms of proton transport in interfacial layer • Is good proton conductivity possible with minimal hydration? Assumptions: • decoupling of aggregate and side chain dynamics • map random array of surface groups onto 2D array • terminating C-atoms fixed at lattice positions • remove supporting aggregate from simulation • Car-Parrinello NVT simulation at T = 300K • Simulation time = 20ps • The frequency spectrum is calculated as a Fourier transform of velocity correlation function: 2. Stable Structural Conformation • The fluctuations of sidechain rotation and sidechain tilting are responsible for proton transfer. • There is a weak coupling between collective coordinates and the rest of the degrees of freedom. • Low frequencies ≈ 100cm-1 are responsible for proton transfer. Formation energy as a function of sidechain separation for regular array of Triflic acid, CF3-SO3-H Computational details highly correlated independent • Ab-initio calculations based on DFT (VASP) • formation energy as a function of dCC • effect of side chain modification • binding energy of extra water molecule • energy for creating water defect 4. Conclusions • Correlations in interfacial layer are strong function of sidechain density. • Transition between upright (“stiff”) and tilted (“flexible”) configurations at dCC = 6.5Å involves hydronium motion, sidechain rotation, and sidechain tilting. • Reducing interfacial dynamics to the evolution of 3 collective coordinates enabled determination of transition path (activation energy 0.55 eV). • The frequency of normal modes for sidechain rotation and tilting are calculated using Morse potential fit and compared with frequency spectrum from AIMD simulation. 2D hexagonal array of surface groups Unit cell: Side view Upon increasing sidechain there is a transition from “upright” to “tilted” structure occurs at dCC = 6.5Å dCC Upright Tilted fixed carbon positions The tilted structure can be found in 3 different states: - fully dissociated - partially dissociated - non-dissociated References • A. Roudgar, S. Narasimachary and M. Eikerling, J. Phys. Chem.B110, 20469 (2006). • M. Eikerling and A.A. Kornyshev, J. Electroanal. Chem. 502, 1-14 (2001). K.D. Kreuer, J. Membrane Sci. 185, 29- 39 (2001). • C. Chuy, J. Ding, E. Swanson, S. Holdcroft, J. Horsfall, and K.V. Lovell, J. Electrochem. Soc. 150, E271-E279 (2003). • E. Spohr, P. Commer, and A.A. Kornyshev, J. Phys.Chem. B 106, 10560-10569 (2002). • M. Eikerling, A.A. Kornyshev, and U. Stimming, J. Phys.Chem.B 101, 10807-10820 (1997). The largest formation energy E = -2.78 eV at dCC = 6.2 Åcorresponds to the upright structure.