Pseudo-GLM From DC-LMA
Pseudo-GLM From DC-LMA. Bryan Jackson General Forecaster WFO LWX. Introduction. Utilizing Total Lightning data from the DC-Lightning Mapping Array ( DC-LMA ) to create a preview of the Geostationary Lightning Mapper ( GLM ) data via Pseudo GLM

Pseudo-GLM From DC-LMA
E N D
Presentation Transcript
Pseudo-GLMFrom DC-LMA Bryan Jackson General Forecaster WFO LWX
Introduction • Utilizing Total Lightning data from the DC-Lightning Mapping Array (DC-LMA) to create a preview of the Geostationary Lightning Mapper (GLM) data via Pseudo GLM • COMET Parnter’s Project – GOES-R Proving Ground • Discussion on effective training modules
Total Lightning • All lightning flashes • NLDN detects CG strikes only • GLM/LMA detect ICCCCG flashes • Studies have correlated thunderstorm strength with total lightning source density and flash rate trends or “lightning jumps”.
DC-LMA • 10 VHF sites in Baltimore-Washington DC metro • ~100 km effective radius • Resolution • 2 minute temporal • 1 km spatial • Source density • Each segment of a flash • Number of flashes known The 10 DC-LMA sites Dr. Geoffrey Stano’s presentation on total lightning and LMA http://weather.msfc.nasa.gov/sport/training/LMA/player.html
GLM • On-board GOES-R series • First sensor of this kind on GOES • Optical pulse detection with imager • Lightning flashes across entire field of view • Resolution • 8-14 km spatial (~10 km near DC) • High temporal (NWS delivery rate?) • 2015 scheduled launch
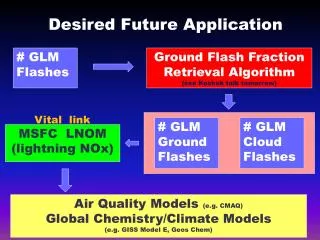
Pseudo GLM • Flash count per grid cell • 10 km grids for DC area • Greater counts near cell core • Stronger the core, the more flashes expected. • Easy discriminator of cell intensity Dr. Geoffrey Stano’s presentation on pseudo-GLM http://weather.msfc.nasa.gov/sport/training/pseudo_GLM/player.html
DC-LMA vsPseudo GLM Washington D. C. Source Density from DC-LMA Flash Density from pseudo GLM
Project • COMET Partners Project • Scott Rudlosky, PhD CICS-MD College Park. • Dustin Shea, UMD Met grad student. • Demonstrate utility of GLM in severe weather via DC-LMA pseudo-GLM • WES case(s) and job sheets
Work and Plans • Two cases selected from DC region: • April 20, 2008: low-topped QLCS tornadoes • KLWX down for most of the event • June 3, 2009: multi-cell clusters • Hail, Wind, EF-1 tornado • Utility of flash rates in severe weather decision making
Discussion • Questions? • What would you like to see for training modules? • Particular storm types • Lead time improvement over Reflectivity and NLDN • Preferred training type • Formal WES case • Job Sheet (like dual-pol training)
DC-LMA example July 18, 2012 First SVR 2019 UTC Second SVR 2029 UTC Trees Down Fort Meade, MD 2045 UTC 15 min severe report lead time
Intro to GLM (stats about what the sensor will do and provide, particularly for NWS forecasters)Intro to the project (creating pseudo GLM data from DC-LMA data)Example slide of what pseudo GLM data will look like (from one of the cases).Project plan and future work (job sheets or Wes case)Discussion on what forecasters would like to see.