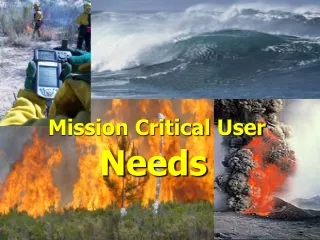
Determining CRITICAL TRANSPORTATION NEEDS
260 likes | 383 Vues
This presentation, delivered by Dr. Betty Hearn Morrow at the National Hurricane Conference, outlines three vital projects aimed at identifying and addressing critical transportation needs (CTN) in underserved populations in Alabama. The projects involve developing a GIS-referenced database of demographics, conducting surveys targeting vulnerable groups, and establishing a community outreach campaign. Emphasizing collaboration with local agencies, the initiatives aim to enhance emergency preparedness and improve resilience within at-risk communities.

Determining CRITICAL TRANSPORTATION NEEDS
E N D
Presentation Transcript
Determining CRITICAL TRANSPORTATION NEEDS Dr. Betty Hearn Morrow National Hurricane Conference Austin, TX April 9, 2009
THREE RELATED PROJECTS • Development of a Model: Alabama Critical Transportation Needs FEMA, Corps and AEMA Thru Dewberry • Technology and Vulnerable Groups Community & Regional Resilience Initiative Oak Ridge National Laboratories (CARRI) • Risk Behavior and Communication NOAA Coastal Services Center
Development of a Model:The Alabama CTN Project Dewberry & Davis Betty Hearn Morrow Hugh Gladwin Lauren Hand Robert Goldhammer Chris Zambito
Development of a Model:The Alabama CTN Project I. Gather demographics of area • Examine latest U.S. Census and other population data for relevant categories: • Households without private transportation • Households with individuals with disabilities • Households with elderly • Households below poverty level • Put into a GIS-referenced database to see where clusters appear
Gather Data Those Most Likely to have CTN • Contact Agencies that Serve These Populations • Area Alliance on Aging • Meals on Wheels program • Adult day care • Homeless coalition • Non-profits working with various health issues • Home health care • Dialysis • Cerebral Palsy • Cancer, etc. • Public health programs • Women, Infants and Children (WIC) program • Veteran’s Outpatient Services • Power companies with records of power dependent persons • Place client addresses into GIS-referenced database
III. Conduct survey targeting those identified regions • Set the stage – publicity, etc. • Draw sample from targeted regions
III. Conduct survey targeting those identified regions • Conduct a survey to identify CTN • Automated System? • Connect CTY • RapidCast • Etc. • Telephone Poll
V. Ground Truth the Results • Meet with community groups • VOAD • Emergency management task forces • Representatives from local social service agencies • Representatives from health and medical providers • Discuss findings and implications
FEMA: “Register with the office of emergency services or the fire department for assistance so needed help can be provided.” www.fema.gov/plan/prepare/specialplans.shtm
VI. Conduct Registration Campaign • Set up central system, including maintenance • 211 or 311 • Special number in government agency • Special number in non-profit • Volunteer Mobile • Publicize program • PSAs • Brochures, leaflets. flyers • Local newspapers • Websites • Email
TECHNOLOGY AND VULNERABLE GROUPS: COMMUNITY & REGIONAL RESILIENCE INITIATIVE OAK RIDGE NATIONAL LABORATORIES John L. Kiefer University of New Orleans Jay Mancini Virginia Tech Betty H. Morrow Florida International University Hugh Gladwin Florida International University Terina A. Stewart Oak Ridge Associated Universities
SURVEY OF AN AT-RISK SAMPLE ON USE OF TECHNOLOGIES - CHARLESTON, SC Description Of The Sample
Sources of Hurricane Information Most Important Sources: TV 68.4%, radio (15.7%), Internet (6.2%)
RISK BEHAVIOR AND COMMUNICATION NOAA COASTAL SERVICES CENTER Betty Hearn Morrow Florida International University
Literature Review • Synthesis of existing social science research related to risk perception and communication Improving Coastal Risk Communication: Guidance from the Literature
Social Marketing • Start with target audiences most ready for action or change • Promote single, simple, doable behaviors • Identify and remove barriers • Promote benefits over fears • Highlight costs of competing behaviors • Promote a tangible target • Get leaders involved, committed
Best Practices • Collect examples of successful social marketing campaigns • Don’t Mess With Texas • Turn Around, Don’t Drown • Click It or Ticket • Save the Crabs – Then Eat Them!
Reference: Promoting Access to Resilience-Enhancing Technologies for Disadvantaged Communities and Vulnerable Populations http://www.resilientus.org/reports-other.html Dr. Betty Hearn Morrow betty@bmorrow.com Phone: (305) 385-5953