Climate Change and California Forests
240 likes | 376 Vues
This comprehensive analysis explores the significant effects of climate change on California's forests, focusing on historical climate patterns and future projections based on advanced climate models. It highlights the relationships between temperature changes, precipitation variability, and their influence on vegetation types and species interactions. The study addresses shifts in forest communities, habitat loss due to warming, increased fire risk, and the responses of specific species to climate stressors. Insights from historic climate events provide a context for understanding contemporary challenges facing California’s forests.

Climate Change and California Forests
E N D
Presentation Transcript
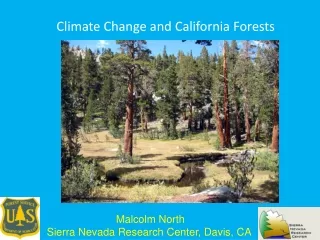
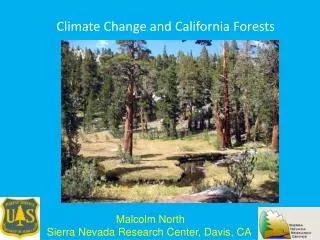
Climate Change and California Forests Malcolm North Sierra Nevada Research Center, Davis, CA
Courtesy of Hugh Safford Greatest changes are in nighttime minima June May October Tahoe City 1875 m
Temp-HAD Temp-PCM Precip-HAD Precip-PCM 20 2000 18 1600 16 1200 14 Temperature (C) Precipitation (mm) 800 12 400 10 0 2000 2020 2040 2060 2080 2100 Year California future climates: alternate scenarios 60% of climate models predict increased ppt for California in general 23% predict decrease 17% predict no change Source: Electrical Power Research Institute 2003 HAD = Hadley Center 2 model: Very warm-wet future PCM = Parallel Climate Model: Warm-dry future Courtesy of Hugh Safford
Loss of habitat as warming drives veg-types higher Warming benefits broad-leaved spp at expense of needle-leaved Expansion of C4 grassland Loss in shrubland due to increase in fire (= grassland) or higher ppt (= trees) Courtesy of Hugh Safford
Vegetation community responses Historic conditions, and predictions for 2100 based on the Hadley and PCM models Lenihan et al. 2003. Ecol Appl 12. Courtesy of Hugh Safford
ABMA PIAL QUKE ABCO PSME PIPO Species-specific responses: species will respond based on their own physiological response and their interactions with other species. Future communities will not look like current communities. Courtesy of Hugh Safford Chaparral and gray pine
Centennial-Scale Climate Trends Holocene MULTI-PROXY ANALYSIS Early Holocene 10500 to 7500 YBP Warming Mid-Holocene 7500 to 5000 YBP Warmest, Dry Post Mid- Holocene Transition 5000 to 3500 YBP Cooling, Wetter Neoglacial 3500 to 2600 YBP Cool, Wet Post-Neoglacial Drought 2600 to 1600 YBP Intense Drought Post-Drought Transition and Medieval Warm Period 1600 to 650 YBP Dry but Summer Wet Little Ice Age 650 to 150 YBPCool Wet, Cool Dry Recent < 150 YBP Warm, wet Courtesy Connie Millar From Tausch et al. 2004
Giant Sequoia Glacial: Interglacial Dynamics Current range, W Sierra, 1370-2200m Central Valley, 54m, 26-22kyr Kings Cyn, 1000m, 20kyr East Lk, 2863m, < 10kyr Mono Lk, 1950m, 10-11.5kyr Davis 1999a, Davis 1999b, Power 1998, Cole 1983
Past Climate Analogs: Mid Holocene: (3,000 B.C.-1,500 B.C.) Wetter period: Increase in fir and cedar, relative to pine and a decrease in oak Middle Warming Period (approx. 900-1200 A.D.): Rise in tree line but no significant vegetation shifts Early 20th Century (1880’s-1950): Warming (recovery from little Ice Age) and wet period Reconstruction or Pre-European Period (1800-1840) Very unusual period: end of the little Ice Age with cool, dry conditions
Historic Climate Naturally Fluctuated • Cyclically • Nested Time Scales - Millennial - Centennial - Decadal - Interannual • Rapid and Abrupt Transitions Plants track climate at each scale, but respond with unexpected lags and threshold behaviors Millar 2003
Southern California forests: interactions of multiple stressors PIPO ABCO PIPO ABCO PIJE PILA PIJE PILA ABCO ABCO Sensitivity to air pollution (N and ozone) Sensitivity to water stress Susceptibility to insect/disease Sensitivity to increased temperatures Sensitivity to fire (adult) CADE PIJE ABCO PIPO PIJE PIPO PIPO CADE CADE CADE CADE Pollution Insects/disease Temps H2O stress Fire Who wins? Courtesy of Hugh Safford
Before fire suppression (1865 on this graph), tree death and recruitment is pulsed by fire and El Nino events North et al. 2005
Oaks were especially sensitive to temperature; Oak species fluctuated from rare to widespread in W Sierra Anderson & Smith, 1994
20th Century Responses: Meadow Invasion Central High Sierra Nevada Studies Found increased colonization in diverse meadows with variable environmental, vegetative, & land-use histories
Mortality in the forest is now primarily driven by drought and beetles • Tree density, from fire suppression contributes to drought stress • The populations of some insects, including many bark beetles, are kept in check by cold over-wintering temperatures * * Mortality significantly higher than expected in high density and lower in low density *
What may happen to mixed-conifer understory herbs and shrubs with increasing nitrogen from air pollution, an increase or decrease in snowpack, and with and without fire? Hurteau and North. In press. • Herb biomass increased in shrub dominated communities when snow pack was reduced. • Nitrogen additions unexpectedly increased herbaceous species richness. • Fire was a more important factor in post-treatment species richness and cover than either snow pack addition or reduction.
What are the effects of different fuel treatments on forest carbon storage and emissions under modeled wildfire scenarios? Hurteau and North. In review.
Amount of carbon accumulated after 100 years without wildfire Hurteau and North. In review.
Amount of carbon released during prescribed burns over 100 years Hurteau and North. In review.
Amount of carbon accumulated after 100 years with a wildfire in 2010
Amount of carbon accumulated after 100 years with a wildfire in 2050 Hurteau and North. In review.
The amount of carbon (tC/ha) stored in live trees and the total amount released over the model’s 100 year run for all prescribed burns (Rx) and for the 2050 wildfire. The 2100 carbon budget is the amount of carbon stored in live trees in 2100 minus the total released in all prescribed fires and the 2050 wildfire for each of the eight treatments. The 2040 trees/ha is each treatment’s stand density in the nearest time step before the 2050 wildfire.
Conclusions: • Forest communities are unlikely to simply move up in elevation or latitude • Tree species will respond differently, making future forest compositions difficult to predict • Snow pack reduction may benefit herbs, but fire is still the strongest influence on the understory • Bark beetles may become a real problem in high density forests, particularly as winter and night time minimum temperatures rise • A preliminary FVS model suggest fuels treatments producing a low-density stand structure dominated by large fire-resistant pines may best protect carbon sinks in wildfire prone forests