Download
1 / 15
280 likes | 1.09k Vues
The Glycemic Index & Load. Fasih Hameed, MD IM Fellow 2008. Glycemic Index: Overview. chemical classification of carbohydrate (simple or complex, sugars or starches, available or unavailable) Provides insight into physiologic effects of carbohydrate intake & health.

E N D
The Glycemic Index & Load Fasih Hameed, MD IM Fellow 2008
Glycemic Index: Overview • chemical classification of carbohydrate (simple or complex, sugars or starches, available or unavailable) • Provides insight into physiologic effects of carbohydrate intake & health. • Delineates measured, functional response of body to foods we eat.
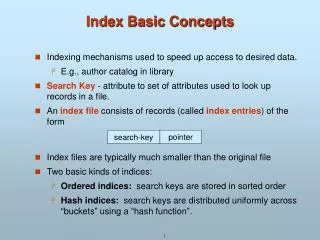
Glycemic Index: Definition • Measure of relative glycemic response to dietary carbohydrates • Rate and degree of blood sugar elevation following consumption. • Reference food: • White bread or Glucose = 100 • Higher index faster and greater rise of postprandial glucose and/or insulin
Glycemic Index: Testing Methods • 5-20 Fasting subjects • 50g carbohydrate load of food administered • Serum glucose measured and plotted 2-3 hour postprandial • Repeated daily • Measured as percent difference in area under curve vs. reference food (100)
Bjorck I, et al: Food properties affecting the digestion and absorption of carbohydrates. Am J Clin Nutr 59: 1994
Glycemic Load • Accounts for average load of carbohydrate in food serving • (GI x Carbs per serving [gr])/100 • more accurate measure of effect on pancreatic insulin release and serum glucose levels • Low GI generally = Low GL • …But High GI can sometimes ≠ high GL (ie. Watermelon GI = 72, GL = 4)
Influences on rate of gastric emptying, digestion, absorption • Soluble Fiber, reduces GI • Glucose vs. Fructose (more slowly absorbed) • Antinutrients (lectins, phytates, enzyme inhibitors) debatable impact • Starch type: Amylose vs. Amylopectin (white vs. basmati rice) • Boiled vs. Par Boiled vs. Raw • Particle size, processing method: Whole grain vs. cracked vs. powderized vs. puffed • Al dente vs. well done
Influences on rate of gastric emptying, digestion, absorption • Genetic variation of plants • Ripeness • Under-ripe bananas GI : 43 • Over-ripe bananas GI: 74 • Protein & Fat • second meal effect • delayed emptying • Acid (sourdough, lemon, vinegar)
Goals • GL ~ 60-80 QD • GI average ~50-55
Health Impacts • Prospective studies show High GL diet linked with DM2, CAD, Cancers. • Low GL dietsustained improvements in abdominal obesity, cholesterol, and glycemic control • High GL dietfatigue (rebound hypoglycemia) • Low GI/L meallower glycemic response at next meal. • High GI dietInsulin resitance & DM2. • Low GL foodsconsume smaller meals, mid meal cravings diminished.
Low GI vs High GI x 2 weeks • 37% lower 12hr blood glucose • 16% lower avg daily BG • 9% lower A1C • 7% lower fructosamine
Health impacts • Low GI mealless consumption at next meal ( overweight adolescent boys) • Low GI foodsincreased serum CCK “satiety peptide” • Increased exercise performance • Reduced LDL & Triglycerides • Release of Free Fatty Acids after rapid drop in BG
Clinical Utility • DM2 • 2004 metanalysis supporting role • Cardiovascular disease • Reductions in cholesterol, but need larger studies to determine mortality impacts • Anti-inflammatory diet • DM: hyperglycemia reactive oxygen specieslipid peroxidationatherosclerosis. • Non-DM: Hyperglycemia production of reactive oxygen species resultant oxidative cellular damage inflammatory responses. • Cancers • High GI associated with increased Gastric, colorectal, & upper GI cancers. • Slightly higher risks of endometrial & pancreatic. • No apparent impact on Breast CA.
Factors to Consider • No “Good” or “Bad” Foods • Remember Glycemic Load • Nutrient Content vs. GI • Fructose (lower GI) shown to increase insulin resistance • Shape of Curve (ie. Orange Juice, rapid absorption) • Add 30 to GI calculations which use white bread to compare to glucose scale.
Websites • http://www.mendosa.com/gi.htm • www.glycemicindex.com