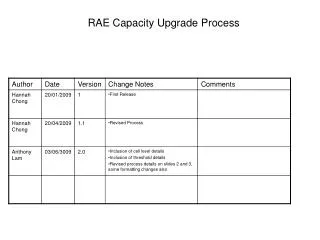
Process Capacity
Process Capacity. Chapter 6. Define scope 2. Document process 3. Redesign Process (Capacity change) 5. Implement changes 6. Evaluate performance 4. Redesigning a Process Through Capacity Change. Identify opportunity 1. Figure 6.1. To customers. Inputs. 1. 2. 3. 200/hr.

Process Capacity
E N D
Presentation Transcript
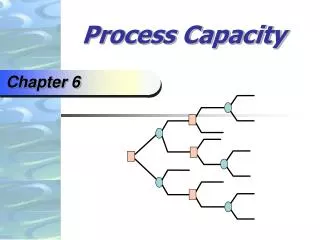
Process Capacity Chapter 6
Define scope 2 Document process 3 Redesign Process (Capacity change) 5 Implement changes 6 Evaluate performance 4 Redesigning a Process Through Capacity Change Identify opportunity 1 Figure 6.1
To customers Inputs 1 2 3 200/hr 200/hr 50/hr Capacity Bottlenecks (a) Operation 2 a bottleneck Figure 6.2
To customers Inputs 1 2 3 200/hr 200/hr 200/hr Capacity Bottlenecks (b) All operations bottlenecks Figure 6.2
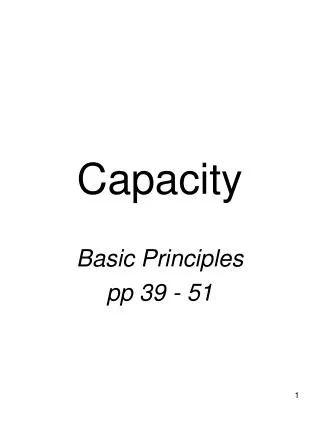
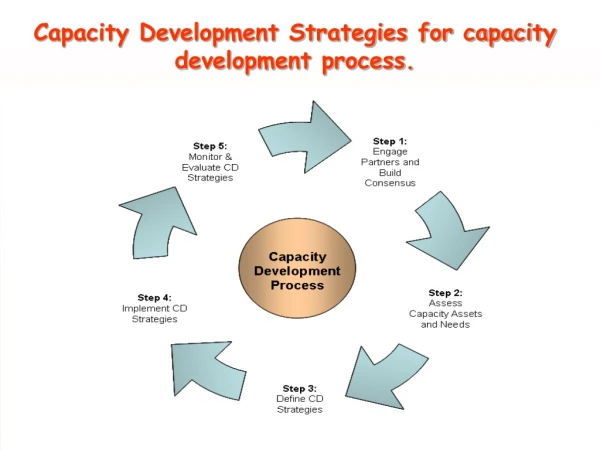
250-bed hospital 750-bed hospital 500-bed hospital Average unit cost (dollars per patient) Economies of scale Diseconomies of scale Output rate (patients per week) Economies and Diseconomies of Scale Figure 6.3
Capacity Cushions Capacity Cushion = 100% - Utilization Rate (%)
Forecast of capacity required Planned unused capacity Capacity increment Capacity Time between increments Time Capacity Strategies (a) Expansionist strategy Figure 6.4
Forecast of capacity required Planned use of short-term options Capacity increment Capacity Time between increments Time Capacity Strategies (b) Wait-and-see strategy Figure 6.4
Linking Process Capacity and Other Decisions • Competitive Priorities • Quality • Process Design • Aggregate Planning
50 50[1.0 – .20)] M = = 62.5 customers per day Estimating Capacity Requirements A process serves 50 customers per day, utilization is about 90%, and demand is expected to double in five years. Management wants to increase the capacity cushion to 20%. In 5 years if demand doubles, M = 2 x 62.5 or 125 customers per day Example 6.1
Capacity requirement = Processing hours required for year’s demand Hours available from a single capacity unit per year, after deducting desired cushion Dp N[1 – (C/100)] M = Estimating Capacity Requirements D = demand forecast for the year p = processing time N = total number of hours per year during which the process operates C = desired capacity cushion
Item Client X Client Y Annual demand forecast (copies) 2000.00 6000.00 Standard processing time (hour/copy) 0.50 0.70 Average lot size (copies per report) 20.00 30.00 Standard setup time (hours) 0.25 0.40 Estimate Capacity Requirements Capacity Decisions Example 6.2
Item Client X Client Y Annual demand forecast (copies) 2000.00 6000.00 Standard processing time (hour/copy) 0.50 0.70 Average lot size (copies per report) 20.00 30.00 Standard setup time (hours) 0.25 0.40 5305 1700 M = = 3.12 4 machines Estimate Capacity Requirements Capacity Decisions Example 6.2
Low demand Don’t expand High demand Small expansion 2 Expand 1 Low demand Large expansion High demand Decision Trees Capacity Decisions Figure 6.7
Low demand [0.40] $70 Don’t expand $90 High demand [0.60] Small expansion 2 Expand 1 $135 Low demand [0.40] Large expansion $40 High demand [0.60] $220 Decision Trees Capacity Decisions Figure 6.7