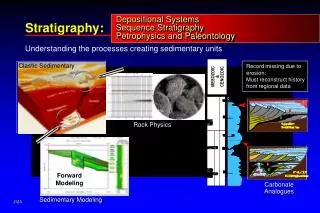
Seismic Stratigraphy EPS 444
Seismic Stratigraphy EPS 444. Dr. Faisal A. Alqahtani 2011 email:falqahtani@kau.edu.sa 3. Data Types. What is seismic data? – theory from a geologists perspective….


Seismic Stratigraphy EPS 444
E N D
Presentation Transcript
Seismic StratigraphyEPS 444 Dr. Faisal A. Alqahtani 2011 email:falqahtani@kau.edu.sa 3
What is seismic data? – theory from a geologists perspective… • In seismic reflection surveys the travel times are measured of arrivals reflected from subsurface interfaces between media of different acoustic impedance. • In areas where subsurface horizons are generally shallowly dipping velocity varies mainly as a function of depth due to the different physical properties of the individual rock layers…
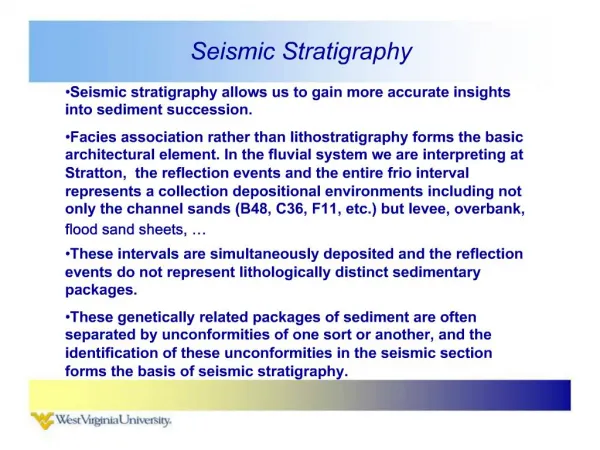
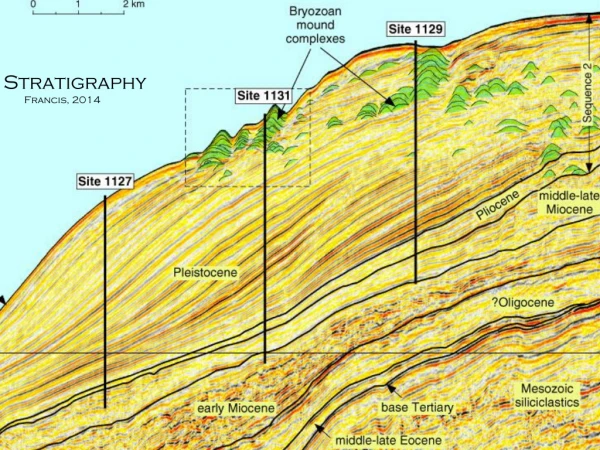
What is seismic data? – from rocks to traces (I) • Seismic sections can be made from 2D outcrops and greatly aid our understanding of the link between geology and geophysics. • In particular we can understand how the acoustic properties of the rock vary with lithology and depositional environment and how these are represented on seismic reflection sections. • The example to the left comes from some deep water channel deposits in the Ainsa Basin, Northern Spain. • This study of seismic expression of lithologies and link to depositional environment is called seismic facies analysis (more later).
What is seismic data? – from rocks to traces (II) • The image to the left compares the outcrop-derived seismic section shown in the previous slide to a real seismic example from offshore West Africa. • Notice the similarity in the geometry between the outcrop and seismic examples, especially the low-angle dipping surfaces (outcrop) or reflections (seismic). These represent laterally migrating point bars within the inner meander loop of the channel. • What are the pros and cons of each data type?
How big is it? A 10 km x 10 km (100 km2) 3D survey at 25 m line spacing contains 400 x 400 which equals 160,000 traces… …the majority of 3D surveys now have line spacing of 12.5 m resulting in 640,000 traces per 100 km2 dataset! Time samples are recorded at every 4 ms, so a single trace covering 4 s in time = 1000 time traces resulting in 6.4 x 10⁸ samples for our 100 km2 3D seismic survey. For each sample either 8 bits or 16 bits of digital storage required to record the amplitude value of the sample. Volume of data to be interpreted = number of lines x number of crosslines x number of time samples x number of data types
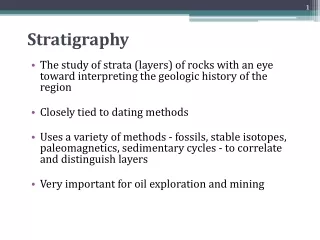
Why do we need to interpret seismic data? – geological analysis • To image the structure of the earth’s subsurface to better understand its temporal and spatial evolution.
Why do we need to interpret seismic data? – geological analysis • To image the stratigraphy of the earth’s subsurface to better understand its temporal and spatial evolution.
Why do we need to interpret seismic data? – applied aspects • To locate structural features that may contain exploitable hydrocarbon resources.
Why do we need to interpret seismic data? – applied aspects • To locate stratigraphic features that may contain exploitable hydrocarbon resources
How do we interpret it? • We need four basic things to interpret seismic data: • Eyes • Seismic section • Pencils • Imagination • Geological background
How do we view it? Understanding of the relationship between features observed in vertical and map-view (timeslice) seismic sections can be aided by using 3D visualisation packages. In the example to the right from the Northern North Sea a chair display is used to observe the relationship between the cross-sectional and map-view seismic expression of a channel.
Why a workstation? • automatic management of the data • digitally stores any position, travel time and amplitude of an interpretation in the database • display seismic trace in different formats (e.g. wiggle display, variable amplitude colour displays) • can exploit 3D volume of data - scan through data; visualize in 3D; plot well trajectories & logs; add in 2D regional seismic lines to database • can flatten seismic data to a specific event • allows automatic picking by using interactive volume tracking • computation power of workstation-> ‘process’ interpretations; generate attribute maps & calculate attributes in volumes • export/import data to other programs (e.g. mapping packages, reservoir modelling packages, well-interpretation packages)
How long does it take? • Data loading • Data preview, choosing displays • Basic interpretation of horizons and faults • Refinement of interpretation • Creation of isopach maps, depth maps • Attribute analysis for detailed stratigraphic or structural analysis • Further detailed reservoir studies • …can take several months/years!
Why 3D? – Applied aspects… • Better (spatial) imaging of the subsurface • New reserves • Fewer dry & marginal exploration wells • Optimization of number and placement of production wells • Rejuvenation of old fields • Appraisal/development planning cycles reduced • Improved field management during lifetime due to “direct” imaging of fluids
3D seismic data – cost benefits from Brown, 2003
3D seismic data – cost benefits from Brown, 2003