Download
1 / 29
290 likes | 437 Vues
Opportunities in Low Interest Rate Environment. Kevin Dickey & Larry Wright. Private Wealth Advisors. October 18, 2012. CRC 456822 – 1/2012. Morgan Stanley Dallas Private Wealth Management Team. Kevin T. Dickey, Executive Director, Private Wealth Advisor

E N D
Opportunities in Low Interest Rate Environment Kevin Dickey & Larry Wright Private Wealth Advisors October 18, 2012 CRC 456822 – 1/2012
Morgan Stanley Dallas Private Wealth Management Team • Kevin T. Dickey, Executive Director, Private Wealth Advisor • Larry K. Wright, Senior Vice President, Private Wealth Advisor • Benjamin J. Sweeney, Vice President, Financial Advisor • Diana Nuñez, Registered Marketing Associate • Teresa L. Hall, Registered Client Service Associate
If Things are So Good . Why Do I Feel So Bad?
1906 • Early 1900, the average life expectancy was 47 yrs • The infant mortality rate was 10% • 8% of the homes had telephones • Three-minute call from San Francisco to New York cost $21 • The average wage was $0.22 per hour • Less than 1% of households earned the equivalent of $75,000 today
1906 • 25% of the households had running water • There were 8,000 cars, 144 miles of paved road and a maximum speed limit in most cities of 10-mph. • Top 3 killers were: • pneumonia • tuberculosis • diarrhea • The average manufacturing workweek was six, twelve hour days • The percentage of households with air-conditioning was zero
But This Time, . It’s Different…
The economy is in full-scale retreat, with the purchasing power of the dollar less than half what it was five years earlier. Professional and salaried workers are worse off than any time in the last 50 years. Many blame mass advertising and easy credit for these problems. • While Americans take pride in the country's remarkable growth over the past century, many are convinced the old moral and spiritual values are being undermined by industrialization, standardization, globalization and a mass consumer society. • Newspapers and magazines move from objective purveyors of the news to commentators who take positions. Entertainment begins to replace journalism and gossip replaces the news.
The largest ponzi scheme in the nation's history robs 40,000 people of much of their life savings. • Democrats want to increase taxes on the wealthiest Americans while Republicans believe this would curtail job growth and increase prices thus hurting the average American. • The cult of celebrity is sweeping the nation, Fame is conferred more on notoriety than achievement and distinction. • The number of newspapers decline by 2,000 over a 15 year period.
24 Hours a Day Seven Days a Week .
Sale of Fear In Popular Press .
Material Want vs. Meaning Want .
Understanding Your Risk Exposure .
Where Do We Stand? • 2012 Economic Assumption: Sluggish Growth at best, recession odds have increased • Themes for 2012: • The two speed global economy: Developed Markets vs. Emerging Markets. • Policy-related mistakes both in the US and Euro Zone represent risks • Managing through the “Headlines” risks • Known headwinds: • Financial contagion from the Euro Zone • Stubbornly high unemployment • Housing • Dwindling fiscal support for state & local governments • Bottom line: Sluggish economy, a peak in inflation and ‘safety premiums’ should keep US interest rates low on a historical basis • So how does this impact fixed income markets?
Morgan Stanley Smith Barney Fixed Income Strategy 2012 Outlook* • Fed likely to remain overly accommodative – The Fed will finish ‘Operation Twist’ and may consider other unconventional easing measures • EuroZone ‘headline risk’ to remain a factor • Fundamental backdrop (sluggish growth, low inflation) should keep US Treasuries yield historically low • In terms of rates, the most attractive yield curve locations include: Municipal Bonds: 6-14 year maturities Taxable Bonds: - Investment Grade: 7-10 year maturities - High Yield: 3-5 year maturities - Treasuries: 3-7 year maturity • Given heightened uncertainty, our Strategists emphasis is on the following Fixed Income strategies: • Intermediate-term, Investment Grade Corporate bonds • Municipal Securities (State GOs & essential services) * See Basis Points, by Chief Fixed Income Strategist Kevin Flanagan, for current outlook and portfolio strategy recommendations.
Investment Strategies for Fixed Income in 2012 • Consider the opportunity costs of being overweight in cash and cash alternatives. • Balance the risk profile of your portfolio with fixed income. • Asset allocation strategies may allow you to potentially reduce volatility in your portfolio without sacrificing return.1 • Diversify your fixed income portfolio by maturity dates, asset class, credit quality, currency, etc.1 • Focus on opportunities in improved corporate credit profiles and relative value in higher credit quality municipals – yield curve location will be a key to maximizing fixed income opportunities • Consider constructing a laddered portfolio to help meet future goals. • A barbell strategy is one method of balancing flexibility and income. 1 Asset Allocation and Diversification does not assure a profit or eliminate the risk of loss.
Inflation and Real Rates of Return* Year 10-Year T-Note CPI Real Rate of Return 1980 1985 1990 1995 2000 2005 2006 2007 2008 2009 2010 2011 11.43 10.62 8.55 6.57 6.03 4.29 4.80 4.63 3.66 3.26 3.22 2.78 13.5 3.6 5.4 2.8 3.4 2.3 3.2 2.8 3.8 -0.4 1.6 3.2 (2.07)% 7.02 3.15 3.77 2.63 1.99 1.60 1.83 (0.14) 3.66 1.62 (0.42) Sources: Federal Reserve Board, Bureau of Labor Statistics and Morgan Stanley Research *All rates above reflect 12-month averages for the given year and are for illustrative purposes only. Past performance is no guarantee of future results.
Changing Interest Rates: A Historical Look at Average Short-Term Yields Average Short-Term Yields* Source: Federal Reserve Board, Jan 2012 * Past performance is no guarantee of future results. Fed Funds rate is the interest rate at which depository institutions lend balances to each other overnight
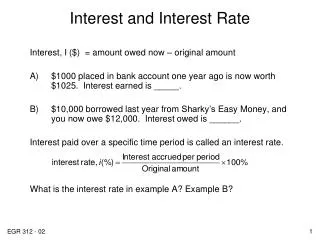
Overview of Fixed Income Securities • Bonds are debt obligations of governments, agencies and corporations. The issuer is obligated to pay the investor interest at a specified interest rate over the life of the bond and to return the bond principal at maturity. • Certificates of Deposit (CDs), also known as “time deposits” and issued by a bank, provide investors with interest in return for allowing the bank to use the funds over a specified time period. • Preferred Securities are investments with both equity and debt characteristics. • Fixed Income Sectors: Interest SensitiveCredit SensitiveMunicipal Treasury Securities Corporate Bonds General Obligation US Agency Securities High Yield Bonds Revenue Bonds Agency & GSE Mortgage- Foreign Currency Bonds Pre-Refunded Bonds Backed Securities (MBS) Emerging Markets Debt Taxable (incl. BABs) Zero Coupon Bonds Preferred Securities High Yield Bonds Certificates of Deposit (CD) Non-Traditional Munis
Investment Strategy: Barbell Portfolio • Barbell strategies concentrate holdings at each end of the maturity spectrum with little to no exposure in the intermediate maturity ranges • Investing a large portion of funds in long-term securities, investors can take significant advantage of higher yields; by simultaneously investing a large portion in short-term securities, investors can benefit from liquidity. • A barbell strategy can offer protection and flexibility in the event of a considerable rise or decline in interest rates. A Sample Barbell Strategy ($300,000 portfolio) Hypothetical illustration. Not representative of any specific investment. The barbell strategy of income investment strategy involves buying a mix of short and long-term bonds so that the portfolio has the same prices sensitivity to interest-rate.
Investment Strategy: Laddered Portfolio • A laddered strategy involves dividing investment money among bonds that mature at different set intervals. • Can provide structure, stability and a predictable flow of principal while potentially reducing exposure to reinvestment risk • Designed to meet your individual financial objectives including those related to time horizon, risk tolerance, income and principal preservation: Whether you are interested in balancing your portfolio, reducing your reinvestment risk or planning for future needs, the laddered portfolio investment strategy may help you meet your financial goals. A laddered portfolio, however, may result in a lower return than a non-laddered portfolio.
The Cost of Waiting • Assumptions • $500,000 investment in municipal bonds • 0.65% increase in intermediate-term (10yr) municipal rates over the next 12 months • 0.01% money market account rates over the last 12 months • Scenario 1 • Purchase a 10-yr tax-exempt “AA” rated municipal bond yielding 2.15% • Scenario 2 • Remain in a tax-exempt money market account for one year at 0.01%, and then invest in a 10-year tax-exempt • municipal bond hypothetically yielding 2.80%, or 0.65% higher than prevailing intermediate-term (10yr) • municipal rate.
What Are Other Telephone Cooperatives Doing? • Conservative Tax-Free Fixed Income Portfolio • Maturity (3-7 years) • 3-year avg. annual return – 3.72% • Last 12 months return – 3.39% • YTD return – 1.65% • ______________________________________________________________________________ • Conservative Balanced Portfolio • 3-year avg. annual return – 7.05% • Last 12 months return – 10.74% • YTD return – 6.50%
How we are different? • Over 14 years of experience working with Telephone cooperatives. Help design and implement investment policy statements for Telephone Cooperatives. Oversee $200,000,000 of telephone cooperative investment assets. • Our practice has a combined 75+ years of experience. • We advise approximate 72 entities. Managing fewer relationships allows us to tailor service to focus on individual needs. • Our team focuses on customizing complex financial solutions for affluent families, business owners and corporate executives. • Every client has specific objectives. We align our expertise and resources to achieve their financial goals.
Morgan Stanley Private Wealth Management Global Footprint—60 Offices in Key Metropolitan Areas Across 4 Continents Introduction to Morgan Stanley Private Wealth Management Private Wealth Management Global Footprint • Over 580 Private Wealth Advisors globally in more than 25 offices worldwide with over $205 billion in assets under management1 • Focus on families with $10mm+ in investable assets • Cover 20% of Forbes 4002 • Generally co-located generally in the same offices as other Morgan Stanley businesses such as Investment Banking, Equities, Fixed Income and Investment Management providing strong linkage to other parts of the firm Seattle Munich Denver London Boston San Francisco Chicago Milan New York3 Menlo Park Atlanta Philadelphia Geneva Delhi Zurich Dallas Washington, DC Dubai Los Angeles Kolkata Houston Riyadh Miami3 Hong Kong Las Vegas Mumbai Bangalore Singapore • Notes • Includes PWM US, LatAm, EMEA, and Asia (as of June 2010) • As of 10/31/2010 • PWM Latin America Coverage based out of Miami and New York 3
Risk Management • Portfolio Risk Management Concentrated & Restricted Stock Advice Asset Liability Risk Management Investment & Risk Management Introduction to Morgan Stanley Private Wealth Management Client’s Goals & Objectives In addition to the deep resources of Morgan Stanley’s Investment Management and Research platforms, the PWM offering includes a range of sophisticated solutions provided through an unparalleled open architecture platform Investment Policy Guidelines Strategic & Tactical Asset Allocation Cash & Fixed Income Equities Alternatives Structured Solutions • Liquidity Management • Discretionary Fixed Income Management • Manager Selection • Discretionary Management • Manager Selection • Hedge Funds / AIP • Managed Futures • Private Equity • Direct Co-Investments • Portfolio Hedges • Interest Rate Swaps • Private Equity • PPVL Insurance 6