Download
1 / 18
180 likes | 334 Vues
A bootstrap variance estimator for the observed species richness in quadrat sampling. Steen Magnussen, Canadian Forest Service, Victoria BC Lorenzo Fattorini, University of Sienna, IT Ron McRoberts, USDA Forest Service, St. Paul Minnesota. TIES09-Bologna, July 5-9, 2009.

E N D
A bootstrap variance estimator for the observed species richness in quadrat sampling Steen Magnussen, Canadian Forest Service, Victoria BC Lorenzo Fattorini, University of Sienna, IT Ron McRoberts, USDA Forest Service, St. Paul Minnesota TIES09-Bologna, July 5-9, 2009
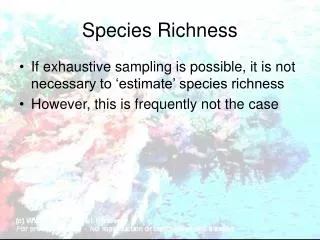
The number of species (S) in a population is an important indicator of biodiversity. • For many populations a census is infeasible. • A sample survey yields an observed number of species S(n) S. • Interest in estimating richness. • Model-based estimation of S and its precision. • Quadrat sampling or k-distance sampling is popular/efficient in vegetation surveys. • Sample locations on a grid or syst. non-aligned.
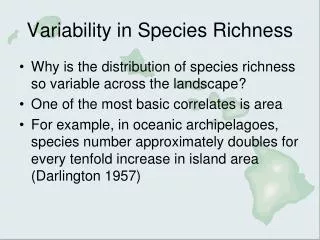
Non-random species associations • Species co-occurrence in a sample unit is predominantly non-random(positive or negative correlation). • Non-randomness gives rise to over-dispersion in the sampling variance of S(n). • Non-random spatial distribution of specieshas no effect on E(S(n)) but lowers efficiency.
Do we need a variance estimator for S(n)? • The sampling variance of S(n) propagates to estimates of richness. • A variance estimator for should be consistent with the estimator of var[S(n)]. • If estimator of S is a function of S(n) and other sample statistics: use delta technique to estimate variance. • We have only one design-based variance estimator for S(n), one that can be adapted to S(n)1, and one based on balanced repeated sample replications2.1.Haas PJ, Liu YS, Stokes L. 2006. An estimator of number of species from quadrat sampling. Biometrics62: 135-142. Magnussen S. 2009. A balanced repeated replication estimator of sampling variance for apparent and predicted species richness. For. Sci.
A design-based estimator of variance • Ugland KI, Gray JS, Ellingsen KE. 2003. The species-accumulation curve and estimation of species richness. J. Anim. Ecol.72: 888-897. • Finite population of N primary sampling units (PSU). • Sampling without replacement. • Impractical but inspirational for the proposed bootstrap estimator of variance. • Designed for sub-sampling applications.
The bootstrap estimator • Generate by N-n hot-deck imputations for non-sampled PSUs. • Bootstrap samples (wor) of size n would miss Δ*S(n) species. • Add Δ*S(n) columns to .
Bootstrap sample • Take a size n (wor) random sample from the augmented matrix • Repeat the sequence of hot-deck imputations, augmentation, and bootstrap sampling B times.
The bootstrap variance estimator • Generate for each bootstrap sample the species sample occurrence indicators Compute var(S(n)) as per Ugland et al.
Assessment of estimator • Simulated wor sampling from large USDA Forest Service FIA collections of plot data. • Sample sizes n = 20, 40,...,120 (fp < 0.05). • FIA plot records treated as finite populations. • State-wide inventories from Georgia (GA), Minnesota (MN), and Utah (UT). • Regional inventory from Wisconsin (ASP212). • Monte-Carlo variance = benchmark (10,000 samples). • Coverage of estimated (95%) confidence intervals.
Conclusions • The bootstrap variance estimator performs reasonably well in low-intensity sampling in species-rich and species-poor populations. • Tendency to underestimate actual variance. • Coverage of CI95’s typically 0.90-0.93. • About par with a Bal. Rep. Repl. estimator • Much better than estimator by Haas et al.