Distribution Networks: control and pricing
610 likes | 811 Vues
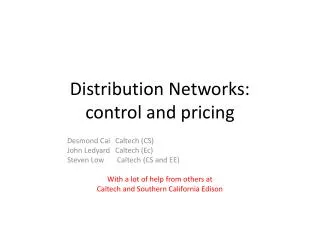
Distribution Networks: control and pricing. Desmond Cai Caltech (CS) John Ledyard Caltech ( Ec ) Steven Low Caltech (CS and EE) With a lot of help from others at Caltech and Southern California Edison. The Problem.

Distribution Networks: control and pricing
E N D
Presentation Transcript
Distribution Networks:control and pricing Desmond Cai Caltech (CS) John Ledyard Caltech (Ec) Steven Low Caltech (CS and EE) With a lot of help from others at Caltech and Southern California Edison
The Problem • Increasing DER adoption implies difficulties for frequency and voltage control • Especially if economical storage is slow to come online • Control of the wholesale side is not enough. • Need to integrate distribution networks (retail) into the management of the grid. U of FL
A Distribution Network:Today external PV Control P Devices HVAC EV Pool pump Etc…. C-P DistributionNetwork L,G control ISO Customer preferences U of FL
A Distribution Network:Adding Demand Response external PV Control P Devices HVAC EV Pool pump Etc…. C-P DistributionNetwork L,G control ISO Customer preferences U of FL
A Distribution Network:Adding Demand Response external PV Control P Devices HVAC EV Pool pump Etc…. This is not enough! C-P DistributionNetwork L,G control ISO Customer preferences U of FL
A Distribution Network:Adding Responsive Demand external PV VolVarControl or “Market” P Devices HVAC EV Pool pump Etc…. C-P DistributionNetwork Bids Prices L,G control ISO Customer preferences U of FL
How should we do this? • Engineers – Give us control • Implementable but not optimal • Economists – Let there be markets • Optimal but not implementable • There is a way that is both implementable and optimal – Smart (economic?) control U of FL
Outline • Optimal Distribution Network Operation • Theory • Direct control • Markets • Smart Control • Simulations We focus on Vol/Var control in 5 min increments • Principles would apply to frequency regulation, etc. U of FL
A Model of the DN: the network U of FL
A Model of the DN: the consumer U of FL
The Goal is Socially Optimal Management Maximize Consumers’ welfare + Producer’s welfare subject to the Laws of Physics and Laws of Economics For now we assume there is only one producer on the network – the Distribution Network Operator. • Assumed to be regulated and willing to follow rules. • Allows us to focus on consumer responses. U of FL
Socially Optimal Vol/Var control Ignores the effect of variance and peak-levels of P on capital costs and depreciation of equipment. (Easily added) Is neutral on distributional effects. U of FL
3 difficulties in solving theoptimal VVC • Computation • NP hard • Non-convexities in the Vol/Var control network • Time scale – We do 5 minute intervals • Is every every 5 minutes enough? • Is every 5 minutes even possible? • Time correlation • Pool pumps, EV,… • Information • The DNO does not know the consumers’ utility functions. • Incentive compatibility • Getting the consumer to “do the right thing” U of FL
The engineers’ solution:Let me control everything • Give the DNO access to the consumers’ devices. • Both controls and information. • Minimize a weighted average of Cost of power (from ISO) + Load Volatility + Peak Power + line/transformer loading subject to the laws of physics. • Maintain standard regulatory average cost pricing policy withpayments for access. U of FL
The Problem with the engineers’ solution • Not optimal • Completely ignores consumer preferences • Doesn’t use the full range of potential consumer responses. • Computation is not easy • Will assume it is computable so we can concentrate on the economics. • In simulations this will have to be dealt with. • Open question: Can economics help the computation? U of FL
The economists’ solution:Let there be markets • A 5 minute market for power at each node. • Centralized, bi-lateral, brokered, an auction … ? • Given prices, consumers maximize utility. • Given prices, the DNO maximizes net receipts from power. • Prices are set so that: consumers’ demands = DNO supply. • Who sets the prices? U of FL
The Problem with the economists’ solution • Optimal only if voltage is not a choice variable. • The equilibrium solves the optimal VVC only if dF/dV = 0. • Markets do not equilibrate instantaneously. • Requires simultaneous solution by consumers and DNO and price setter, but… • No one has the information needed to equlibrate in one shot. • Iteration to equilibrium is infeasible. • If information and calculation are iterated, computational constraints require time to overcome. Not enough time. • Temporary solution is not feasible during iteration. U of FL
Other market-like options • Bidding into the wholesale market • Too intensive cognitively and computationally for retail consumers • Priority pricing • Requires service contracts contingent on external temperatures. • Too intensive cognitively and computationally for anyone. • Prices to devices • Might work. • Let’s analyze in context of distribution networks. U of FL
Optimality of Prices to devices • Given c, the DNO minimizes the cost of power acquired from ISO. • That power demand generates a substation LMP from the ISO. Which determines a local LMP price for each consumer. • Given that price, each consumer chooses c to maximize their utility minus their cost of power. • In equilibrium, this solves the optimal VVC problem. U of FL
Stability of Prices to Devices • Prices to Devices is more likely to be unstable • The more consumers are using the service • The more responsive consumers are to prices • The closer to capacity the ISO is • Paradox: We need consumers to be responsive but if they are too responsive this policy won’t work. U of FL
Summary to here • The Economists’ solution is efficient but not implementable. • The Engineers’ solution is implementable but not efficient. • But , there is an integration that is optimal and implementable – Smart Control U of FL
Smart Control • The consumer “reports” to the DNO. • The DNO solves the Optimal VVC with that . U of FL
Smart Control • Each consumer pays their local LMP price. U of FL
Smart Control • If this is compatible with communication limits, incentives, and computational limits then we will get the optimal VVC solution. • Three issues • Communication: Will the consumer be able to describe their utility function? • Incentives: Will the consumer report the true utility function? • Computation: Will the DNO be able to solve the Optimal VVC with the utility functions in it? U of FL
Will the consumer be able to describe their utility function? • Consider an approximation around the consumer’s ideal setting c*. • The ideal setting is what the consumer would choose if power were free. uc(c*) =0. • The consumer “reports” only two numbers: c*, ucc(c*). • Now a thermostat records a set-point, c*, and reports a temperature, c. • Here a thermostat also records a strength of preference, ucc(c*), and reports a charge, The answer is yes. U of FL
Today’s simple thermostat U of FL
Tomorrow’s thermostat Cool ideal setting Current setting Strength of preference setting Average $/kwh $2.50 74 150 72 Inside Temp Energy cost $20.50 74 System Cool Fan Auto Time period Last 24 hours U of FL
Will the consumer report their true utility function? The answer is yes, subject to local network effects. U of FL
Can the DNO solve the Optimal VVC with the utility functions? • Use the quadratic approximation with information from the consumer. • Can ignore constant term in the optimization. • We are adding quadratic terms to something that is already quadratic. • This problem is no harder than the control-only problem. U of FL
Simulations • Description • Methodology • Results U of FL
Simulated network SCE Rossi circuit • #houses: 1,407 • #commercial/industrial: 131 • #transformers: 422 • #lines: 2,064 (multiphase, inc.transfomers) • peak load: 3 – 6 MW Simulation scenarios • 2012, 2016, 30%PV • Baseline scenario • Optimal scenario
Simulated network DER adoption (only residential houses) • 2012 • PV: 16, EV: 7, both: 3 • PV: 2.4%, EV: 1.5% (cap wrtpeak load) • 2016 • PV: 135, EV:79, both: 15 • PV: 19%, EV: 11% • 30%PV • PV: 200, EV: 119, both: 24 • PV: 28%, EV: 19%
Assumptions Controllable devices • HVAC (through thermostat setpoint) • Plug-in electric vehicle • Pool pumps • Inverters for PV • Adjust control every 5 mins Voltage dependent loads • HVAC, pool pumps, baseload • Parameters from GridLab-D • Implication: drives CVR optimization • Voltage tolerance • + or – 5% of nominal • Implication: set bounds on possible results
Assumptions Power loss on Rossi is small • kW losses: 0.84% • kVARlosses: 3.90% • kVA losses: 1.21% • Implies: A linearized branch flow model is accurate • Assumes no losses on lines • Unlike DC model, does not assume V=1. • Unbalanced
analysis modeling & data power flows cost benefits DER adoption network models estimation & validation database simulations & optimizations user behavior parameter baseline scheduling OPF design market control comm visualization network statistics
analysis modeling & data power flows cost benefits DER adoption network models estimation & validation • SCE Rossi circuit model • Primary and secondary circuits • GRIDLab-D simulation model • Caltech PV adoption model • Using SCE customer data • SCE EV adoption data and arrival/charge stats • SCE LMP for Rossi circuit • Public data on solar irradiance • Centrally recorded weather data database simulations & optimizations user behavior parameter baseline scheduling OPF design market control comm visualization network statistics
analysis modeling & data • Issues w/GridLab-D • Voltages • All house voltages 120V -zero angles • Substation current injection • All constant over time • House temperatures • No heating modeled, temp goes to 60F • Capacitor schedule • Inconsistent with power flow solution • Commercial load • 1 zero load; 1 zero reactive power • Pool pump • Zero reactive power power flows cost benefits DER adoption network models estimation & validation All modeling and GridLab-D simulation data converted into MySQL database simulations & optimizations user behavior parameter baseline scheduling OPF design market control comm visualization network statistics
modeling & data DER adoption network models estimation & validation Use GridLab-D to estimate u and F • User utility • Pool pump reqs • EV behavior Partially validated • to be continued database user behavior parameter design market control comm
Inferring F – HVAC only(voltage constant) • Estimate from 2012 GridLab-D output • Don’t know what’s inside • Separate estimate for each house, office, etc. • Why not • Fits well if not cycling. • In the steady state (e and c constant) • What about V? U of FL
Inferring F – HVAC only • Again use 2012 Gridlab-D output to estimate • Separate estimate for each house, office, etc U of FL
Inferring u – HVAC only • Approximate around 2012 GridLab-D setpoint. • Assume consumer is maximizing u • Given F • Given the regulated price (constant) U of FL
Inferring u – HVAC only • We use demand elasticity estimates from Riess-White (20..) • Estimates are by device • They use monthly demand data U of FL
analysis modeling & data power flows cost benefits DER adoption network models estimation & validation database simulations & optimizations user behavior parameter baseline scheduling OPF Baseline • Multiphase unbalanced BFM; forward-backward sweep Optimal scenario • Linearized multiphase unbalanced BFM; Second Order Cone • Use 2 stage optimization procedure: (1) fix V*, optimize w.r.tc,P,… (2) optimize w.r.t V design market control comm visualization network statistics
Objective Functions • We use …. different objective functions • The Engineer’s • Smart Control U of FL
analysis modeling & data power flows cost benefits DER adoption network models estimation & validation database simulations & optimizations user behavior parameter baseline scheduling OPF design market control comm visualization network statistics
Simulation ResultsCaveat:These results provide upper boundson potential savings They are preliminary and subject to revision with more validation and simulations
Change in Social Payoff Savings seem big: mainly on peak days Savings increase with DER adoption PV 2012: 16, 2.4% 2016: 135, 19% 30%PV: 200, 28% EV: 2012: 7, 1.5% 2016: 79, 11% 30%PV: 119, 19% U of FL
Weekly Total Change in Social Payoff Questions: - Are there significant savings in fixed costs (time scale years)? - Are there significant savings in reductions in reserve requirements? Per unit: 2012 2016 30% 2012 2016 30% (per day)$0.23 $0.26 $0.27 $0.05 $0.06 $0.06 U of FL