Download
1 / 45
450 likes | 574 Vues
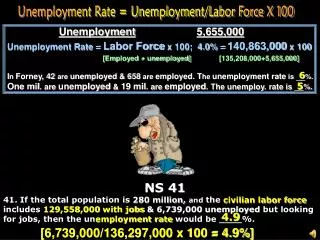
Unemployment Rate = Unemployment/Labor Force X 100. Unemployment 5,655,000 Unemployment Rate = Labor Force x 100; 4.0% = 140,863,000 x 100 [Employed + unemployed] [135,208,000+5,655,000] I n Forney, 42 are unemployed & 658 are employed. T he unemployment rate is __ %.

E N D
Unemployment Rate = Unemployment/Labor Force X 100 Unemployment5,655,000 Unemployment Rate = Labor Force x 100; 4.0% = 140,863,000 x 100 [Employed + unemployed][135,208,000+5,655,000] In Forney, 42 are unemployed & 658 are employed. The unemployment rate is __%. One mil. are unemployed & 19 mil. are employed. The unemploy. rate is __%. 6 5 NS 41 41. If the total population is 280 million, and the civilian labor force includes129,558,000with jobs & 6,739,000 unemployed but looking for jobs, then the unemployment rate would be ____%. 4.9 [6,739,000/136,297,000 x 100 = 4.9%]
Negative/PositiveGDP Gaps Inflationary GDP Gap AS AD2 AD1 AD3 Recessionary GDP Gap 11% 6%1% YR Y*FYi YA YP YA $9 T $10 T $11 T “Natural Rate of Unemployment” [4-6%]
Three Types of Unemployment Frictional– “temporary”, “transitional”, “short-term.” (“between jobs” or “search” unemployment) • Examples: • People who get“fired”or“quit” • to look for a better one. • 2.“Graduates”from high school or • college who are looking for a job. • 3.“Seasonal”or weather-dependent jobs such as • “agricultural”,“construction”,“retail”,or“tourism”. • [lifeguards, resort workers, Santas, & migrant workers.] • Frictional unemployment signals that“new jobs”are available • and reflects“freedom of choice”. • These are qualified workers “transferable” skills.
2.Structural Unemployment Structural–“technological”or“long term”. There are basic changes in the“structure”of the labor force which make certain“skills obsolete”. Automationmay result in job losses. Consumer tastemay make a good “obsolete”. Theautoreduced the need for carriage makers. Farm machineryreduced the need for farm laborers. “Creative destruction”means as jobs are created, other jobs are lost. Jobs of the future destroy jobs of today. Frictional and Structural make up the“natural rate of unemployment”. “These jobs do not come back.” “Non-transferable skills”– choice is prolonged unemployment or retraining.
3. Cyclical Unemployment Cyclical–“economic downturns”in thebusiness cycle. “Cyclical fluctuations”caused by“deficient AD” “Durable goods jobs”are impacted the most. Thesecan be postponedbecausetheycan be repaired. “Cyclical unemployment”is“real unemployment”. “These jobs do come back.”
Survey on Unemployment BLS calls 60,000 households every month. They askthree questions: 1. Are you working?If the answer isno, 2.Did you work at all this month-even 1 day? You are a member of the LF if“yes”on 1 or 2. 3.Did you look for work during the last month? [agency, resume, interview] A“yes”counts you as part of theLF. A“no”means you arenot counted. You are a“discouraged worker.”The labor force consists of theemployedand unemployed.
Unemployment Quiz A. Frictional B. Structural C. Cyclical . 1. A man working for Ford Motor Company is replaced by a robot. 2. A homebuilder loses his job during the recession because houses are not selling. 3. A person who has worked his way through medical school (he has now graduated) has quit his job as a cook at McDonald’s and is interviewing to become a brain surgeon. 4. Automation has cost Alexandria her office job. 5. Now that the economy has improved from a businesscontraction, Rick is looking to get his old job back at Ford. 6.A California citrus picker is temporarily unemployed because of theweather. 7. A bank teller loses her job to an ATM machine. 8. Santa lost his job after Christmas. 9. A Lynch student graduates after 7 years in high school (had to repeat econ 4 times) & is trying to get her first job at Arby’s. 10. Joel is fired at Wendy’s but is interviewing at McDonald’s. 1. B 2. C 3. A 4. B 5. C 6. A 7. B 8. A 9. A 10. A
NS 15-21 upturns downturns 15. The business cycle is defined as the _______ and _______ in business activity. A. EXPANSION B. PEAK C. CONTRACTIOND. TROUGH ___ 16. High point of expansion ___ 17. Period of growth (GDP increases) ___ 18. “Bottoming out” of business activity ___ 19. Laid off workers are called back. ___ 20. Near or at full employment (4-6%) ___ 21. Have averaged 11 monthssince W.W.II. B A D A B C
NS 31-49 31. (Frictional/Structural/Cyclical)is “temporary”,“short-term”unemployment. 32. (Frictional/Structural/Cyclical) is technological,“long-term”unemployment. 33. (Frictional/Structural/Cyclical) is unemployment resulting fromrecessions. A. FRICTIONAL B. STRUCTURAL C. CYCLICAL ___34. Michael lost his job due to therecession[business cycle downturn]. ___ 35.College graduateis searching for his first job. ___ 36. Amanda isquittingWendy’s to work at McDonald’s. ___ 37. There are job losses at Ford due to adecrease in AD. ___ 38.Lifeguardsin the winter andSantasduring the spring. ___ 39. Theauto replaces carriage makers. ___ 40.ATM machines replace bank tellers. 45. Thecost of unemploymentcan be measured by the amount by which (potential/actual) GDP exceeds (potential/actual) GDP. 46. If theunemployment rate is 8%,we can infer that the (potential/actual) GDP is in excess of (potential/actual) GDP. 47. (Inflation/Disinflation/Deflation) is ageneral increase in prices. 48. (Inflation/Disinflation/Deflation) is adecline in prices. 49. (Inflation/Disinflation/Deflation) is adecrease in the rate of inflation. C F F C F S S
AD/AS Primer - NoRecessionary/InflationaryGap AD AS Unemployment 1. Frictional a. quitfor better job b. fired c. graduated d. seasonal 2. Structural [“technological”] replaced by machinery 3. Cyclical downturn in business cycle [“real”unemployment] 3% E [Frictional+Struc.] Real GDP 6% Y*F $10 tr. FE GDP“Bull’s Eye” E– NoINFLATIONARYorRECESSIONARY GAP[Y*] Potential output[$10 tr.] equals actual output[$10 tr.] Actual unempl. rate[6%] equals potential unempl. rate[6%]
OKUN’S LAW • For every one percentage point by which the actual unemployment rate exceeds the "natural" rate of unemployment, realgross domestic product is reduced by 2% to 3%. That is, unemployment above the inflation-threshold unemployment rate reduces GDP below potential output, and for every 1% excess of the natural unemployment rate, a 2% to 3% reduction in GDP is predicted. The difference between actual and potential GDP is called the GDP gap. It may be expressed as a percentage or an absolute amount.
Okun’s Law GDP Gap = Unemployment Rate over 6% x2 7.5% unemployment, so 1.5 x 2% = 3%. [$3 bil. GDP Gap($100 Bil. nominal GDPx3%; or $100 B x .03 =$3 B.) 1. Unemployment is 7%; Nominal GDP is $200 billion. Real unemp. is __%. The % gap is __%. Y being forgone is $__ B. 2. Unemployment is 8%; Nominal GDP is $500 billion. Real unemp. is __%. The % gap is __%. Y being forgone is $__ B. 3. Unemployment is 10%; Nominal GDP is $100 billion. Real unemp. is __%. The % gap is __%. Y being forgone is $__ B. GDP Gap (Okun’s Law)Unemployment Rate above 6% x 2 1 2 4 2 20 4 4 8 8 NS 43 & 44 43.Unemployment is 17%. Nominal GDP is $200 billion. What % is the GDP gap? __% What output is forgone? $___ 44. Unemployment is 16%. Nominal GDP is $300 billion. What % is the GDP gap? __% What output is forgone? $___ 44 22 60 20
Figuring Inflation[Change/Original X 100 = inflation] (2006-later year) (2005-earlier year) Current year’s index – last year’s index199.1 – 192.7 [6.4] C.P.I. = Last year’s index(earlier year) x 100; 192.7 x100 = 3.3% 130.7-124.0(6.7)116-120(-4)333-300(33) 124.0 x 100 = ____ 120 x 100 = ____ 300 x 100 = ____ So, 3.3% increase in Social Security benefits for 2007 5.4% -3.3% 11% NS 50, 51, & 52 50.The CPI was 166.6 in 1999 and 172.2 in 2000. Therefore, the rate of inflation for 2000 was (2.7/3.4/4.2)% 51. If the CPI falls from 160 to 149 in a particular year, the economy has experienced (inflation/deflation) of (5/-4.9/-6.9)%. 52. If CPI rises from 160.5 to 163.0 in a particular year, the rate of inflation for that year is (1.6/2.0/4.0)%. [5.6/166.6 x 100 = 3.4%] [-11/160 x 100 = -6.9%]
Figuring CPI Consumers in this economy buy only two goods–hot dogs & hamburgers. Step 1. Fix the basket. What percent of income is spent on each. Consumers in this economy buy a basket of: 4 hot dogs and 2 hamburgers Step 2. Find the prices of each good in each year. YearPrice of Hot DogsPrice of Hamburgers 2001 $1 $2 2002 $2 $3 Step 3. Compute the basket cost for each year. 2001 ($1 per hot dog x 4 = $4) + ($2 per hamburger x 2 = $4), so $8 2002 ($2 per hot dog x 4 = $8) + ($3 per hamburger x 2 = $6), so $14 Step 4. Choose one year as a base year (2001) and compute the CPI 2001 ($8/$8) x 100 = 100 2002 (14/$8) x 100 = 175 Step 5. Use the CPI to compute the inflation rate from previous year 2002 (175/100 x 100 = 175%) or to get actual %(175-100)/100 x 100 =75%
Figuring CPI For An Individual [2005 MC (42%)] (42%)18. Suppose that a typical consumerbuys the following quantities of these three commodities in 2000 and 2001. CommodityQuantity2000 perUnit Price2001 perUnit Price Food 5 units $6.00 $5.00 Clothing 2 units $7.00 $9.00 Shelter 3 units $12.00 $19.00 Which of the following can beconcluded about the CPI for this individual from 2000 to 2001? a. It remained unchanged. c. it decreased by 20% b. It decreased by 25%. d. It increased by 20% e. It increased by 25%. (Answer) Year 1 [2000]: [5 food x $6 = $30; 2 clothing x $7 = $14; 3 shelters x $12 = $36, for dollar value of $80. CPI = 100 ($80/$80 x 100 = 100 for 2000)] Year 2 [2001]: [5 food x $5 = $25; 2 clothing x $9 = $18; 3 shelters x $19 = $57, for value of $100. CPI =125 ($100/$80 x 100 = 125% for 2001)] So, theCPI increased by 25%.
“Rule of 70” __________________________ “Rule of 70”= % annual rate of increase (3%) = 23 years [Inflation(prices to double)] 707070[Investments to double] 10 = ______ 12 = _____ 9 = _____ [GDP (standard of living) to double] 70 8 years 6 years 7 years 70
6% 16% 10% Real Income [Nominal income –inflation rate=Real Income] - = Inflation Premium Nominal Income Real Income
“Real Income” “Real Income”measures the amount of goods/services nominal income will buy. [% change in real income = % change in nominal income - % change in PL.] 5%10%5% Nominal income rose by 10%,PL increased by 4% - then real income rose by ___%. Nominal income rose by 20%,PL increased by 5% - thenreal income rose by ___%. 6 15 “You will get a 10% raise”
Inflation Since 1954 Above about 3.0% inflation is considered too much. [2.5% in 2006] Take some money out of circulation to make it more valuable. Up in 2004 Tomatoes 50% Fuel Oil 40% Butter 28% Gasoline 26% Home gas 16% Chicken 8% Col. Tuition 9% Sausage 7% Sportstickets 7% Down in 2004 Eggs -20% PCs -14% Photos -14% TVs -12% Lettuce -8% Toys -6% Cars -4% Girls cloth -1% 47. Inflation – overall increase in prices 48. Deflation – decrease in prices (1954) 49. Disinflation – decrease in inflation(1980-83)
Demand-Pull Inflation [“Good News” – more jobs; “Bad News” – higher prices] AS AD2 AD1 PL2 E2 “Bad News” -higher prices PL1 E1 “Good News” - more jobs YI Y*
Disinflationary Recessions [“Good News”–lower prices; “Bad News”–job losses] AS AD1 AD2 PL1 “Good news” -lower prices PL2 “Bad news” - job losses YR Y*
Adverse Supply Shocks[“bad news” – job losses; “bad news” – inflation] AS2 AD AS1 PL2[10%] This economy is stagnating but inflating. Inflating PL1 Stagflation $2.25 Stagnating YR 10% Y*
Traditional Fiscal Policy[“G”& “T”]will not work with Stagflation AS2 AD2 AD1 15% 10% 4% AD3 Stagflation 15% 10% Y*
Beneficial Supply Shocks[“good news”–job gains; “good news”–disinflation] AD AS1 AS2 99 cents PL1 PL2 Y2 Y*
(Measures of Inflation PPI) 2003 PPI was 5.4 in 2005, highest since 1990.The“core PPI” [no volatile food and energy]was only 1.7%. Prices at thewholesaleor production levelwhich areearly indicators of inflation. The2,800 itemsinclude prices forraw materials,intermediate goods, andfinished goods. The PPI does not include services.
Consumer Price Index (CPI) [CPI measures cost of living relative to a base year[100] The CPI is a market basket of364 itemsat 21,000 establishmentsin 91 citiesthat the typical householder buys. It does not include exports because we do not buy exports but does include imports. About55% of the CPI is services.
The “Market Basket” What’s in the CPI’s Basket? Clothing 6.6% Household 10.0% Alcohol 4.5% Health 4.3% Recreation 10.4% Shelter 27.9% Food 18.0% Transportation 18.3%
What was the most popular movie of all time?[Mr. Index Goes To Hollywood] • Box Office Receipts • MovieReceipts (mil.) • Titanic $601 • Star Wars461 • ET 435 • Star Wars[Pha. Men] 431 • Spiderman 404 • LOTR: Return King 377 • Spiderman II 373 • Passion of Christ 370 • Jurassic Park 357 • Lord Rings(TT) 341 • Finding Nemo 340 • Forrest Gump 330 • And – What about “Gone • With the Wind”? #64? • www.the-movie-times.com • Inflation-Adjusted Receipts • Movie Year Receipts(mil.) • 1. Gone With theWind 1939$1,254 • 2. Star Wars 1977 1,084 • 3. Sound of Music 1965 870 • 4. ET 1982 861 • 5. Ten Com. 1956 800 • 6. Titanic 1997 789 • 7. Jaws 1975 783 • 8. Dr. Zhivago 1965 740 • 9. The Jungle Book 1967 662 • 10. Snow White 1937 650
History of Inflation, 1860-2004 $21 $7 2007 $11 $1.50
Tuition at Harvard - $900 Starting salary - $6,000 [college graduate] FICA of 3.125 of $4,800 [$150 maximum] Top marginal tax rate of 91% of incomes over $200,000. New house for $10-15,000 [2.5 times the income of a new college graduate] Coke - 10 cents Movies - .50 Gas, a gallon - $.29 1962 Chevy - $1,500 Tuition at Harvard - $32,300 Starting salary - $44,000 [college graduate] FICA of 7.65 of $94,600 [$7,237 maximum] Top marginal tax rate of 35% of incomes over $326,450 New median house price is $242,000 [5.5 times the income of today’s college grads] Coke - 60 cents Movies - $7 Gas, a gallon - $2.25 2006 Chevy - $23,000 1962 Pricesv.2006 Prices 62 Corvette$2,995 2006 Corvette$58,000
Unemployment,Inflation, &Business Cycles Inflation – “too many dollars chasing too few goods.” Deflation – “too few dollars chasing too many goods.”
Indicators of the Business Cycle[“The leading indicators have predicted 11 of the last 15 recessions”] “Barometer Of The Future” [6-9 months] “Where we are heading” Leading Indicators Ave. work week Building permits Credit Delivery times New orders Inventories New businesses Materials prices Stock prices Money supply New orders Unemployment claims Had a recession in 2001 A drop for three straight months usually indicates a recession is coming.
Indicators of the Business Cycle “Where we are now” • Coincident Indicators • Personal income minus transfer payments • Nonagricultural payrolls • Industrial production • Manufacturing and trade sales
Indicators of the Business Cycle “Where we have been” Lagging Indicators Labor cost, unemployment rate & duration, prime rates, CPI for services, commercial loans, etc.
Full Employment = 4-6% unemployment Wish I had not dropped out of school. Will Work For Food Discouraged workers– those who have given up. Unemployed workers- those who are actively looking. Part-time workers– half employed, half unemployed, but counted as fully employed. Employed workers– those who work for even one hour per week for wages or 15 hours a week if not getting paid. We havefull employmentwhencyclical unemployment is “0”. In Europe, full employment is8-10%.
NS 22-30 22. During arecession, jobs relating to (durable/nondurable) goods are affected the most because they arepostponableand havemonopoly power(few sellers). 23. (Leading/Coincident/Lagging) indicators – statistics that illustrate the direction theeconomy is heading in 6-9 months. 24. (Leading/Coincident/Lagging) indicators – snapshot of the economy“at this time”. 25. (Leading/Coincident/Lagging) indicators – statistics that tell where theeconomy has been. 26.Full employmentoccurs when we have ______% unemployment. The current unemployment rate is ____%. 27. (Discouraged workers/Temporary unemployed workers) are those who havegiven uplooking for a job. 28. Thepresence of discouraged workers&counting part-time workers asfully employedresults in the official rate being (understated/overstated). 29. If2 million out of 8 million unemployed workers become “discouraged” & quit lookingfor work, the official rate would (incr/decr/be unchanged). 30. If3 million part time workers switch to full time work, the official ratewill (fall/rise/remain unchanged). 4-6 5
Demand-Pull&Cost-PushInflation Demand-Pull Inflation– increase in AD. [“Too many dollars chasing too few goods”] Originates from“buyers side of the market” D1 D2 S P2 P1 “Demand-pull” D S2 S1 PL2 PL1 Cost-Push Inflation– 3 things may cause “cost-push” inflation. 1.Wage-push– strong labor unions 2.Profit-push– companies increase prices when their costs increase. 3.Supply-side cost shocks– unanticipated increase in raw materials such as oil. “Cost-push” “Wage-price” Spiral
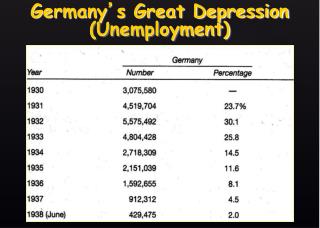
Who wins/loses with 20% Unanticipated Inflation?[Creditors, Debtors, Savers] • The debtor wins with 20%unanticipated inflation. • (some examples) • In 1914, total German mortgage debt was $10 billion marks. • In 1923, $10 billion marks was worth 1 cent.All debt was wiped out. • 2. Signed union contracts agreeing to 3% raisesfor next 3 years. • (A $30,000 salary would increase to $32,782 but it would • take $51,840 to buy what $30,000 would buy 3 years before) • 3. Signed union contracts agreeing to COLAs for next 3 years. • (So a $30,000 salary of 3 years ago would now pay $51,840 • which would buy what $30,000 would buy 3 years ago. • 4. Your Econ teacher buys a $300,000 CDfrom the 1st Econ Bank • which pays him 5% interest for the next 3 years. [Saver] • Mr. Econ would earn $47,288 in interest at 5%, however at • 20%, he could earn $218,400.] So the saver looses here.
Inflation • Who is Hurt by Inflation? • Fixed-Income Receivers • Savers • Creditors • Who is Unaffectedby Inflation? • Flexible-Income Receivers • Cost-of-Living Adjustments (COLAs) • Debtors
NS 54-60 54. (Demand-pull/Cost-push) inflation results from anincrease in aggregate demand[AD]. 55. (Demand-pull/Cost-push) inflation results from anincrease in production costs[wages or input cost]. 56. The only group thatbenefits from inflationare (creditors/debtors/fixed income pensioners).