Download
1 / 2
20 likes | 155 Vues
T3-642. QP 1 ; FP 1. QP 1 ; FP 1. Separation for milk processing. Milk processing. Q RM 1 ; F RM. Q CR 1 ; F CR. Q RM 2 ; F RM. QM P2 ; FP 2. QP 2 ;. QRM. Separation for curd processing. Curd processing. Q CR 2 ; F CR. Q RM 3 ; F RM. Q CR 3 ; F CR. QCR; F CR.

E N D
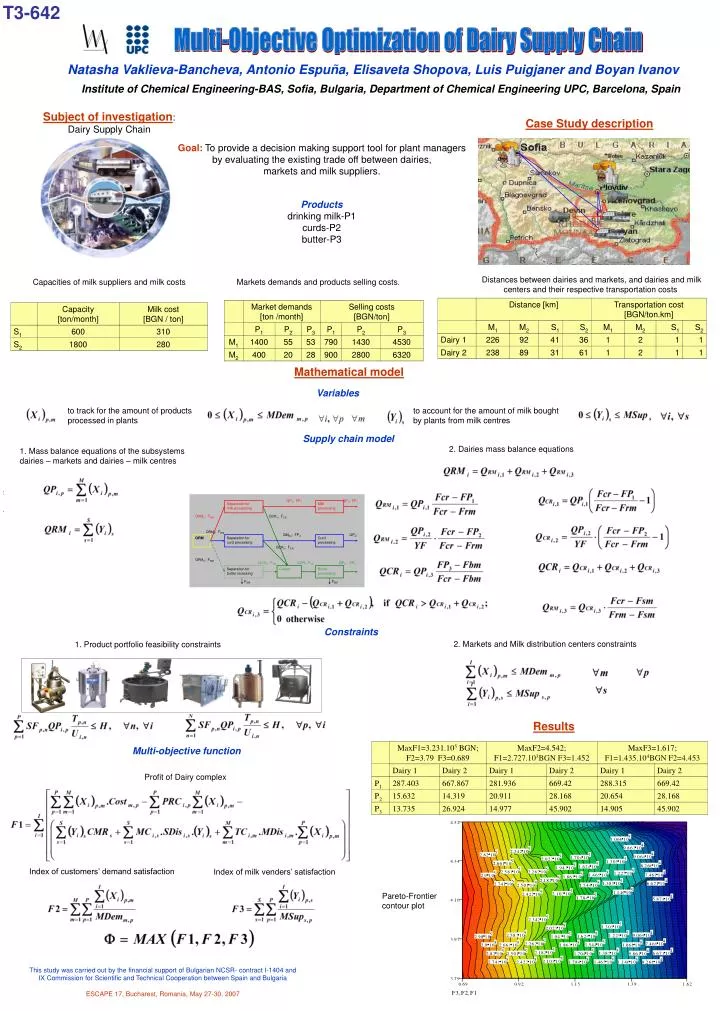
T3-642 QP1; FP1 QP1; FP1 Separation for milk processing Milk processing QRM1; FRM QCR1; FCR QRM2; FRM QMP2; FP2 QP2; QRM Separation for curd processing Curd processing QCR2; FCR QRM3; FRM QCR3; FCR QCR; FCR QP3; FP3 Separation for butter rocessing Cream Butter processing FSM FBM Multi-Objective Optimization of Dairy Supply Chain Natasha Vaklieva-Bancheva, Antonio Espuña, Elisaveta Shopova, Luis Puigjaner and Boyan Ivanov Institute of Chemical Engineering-BAS, Sofia, Bulgaria, Department of Chemical Engineering UPC, Barcelona, Spain Subject of investigation: Dairy Supply Chain Case Study description Goal: To provide a decision making support tool for plant managers by evaluating the existing trade off between dairies, markets and milk suppliers. Products drinking milk-P1 curds-P2 butter-P3 Distances between dairies and markets, and dairies and milk centers and their respective transportation costs Capacities of milk suppliers and milk costs Markets demands and products selling costs. Mathematical model Variables to track for the amount of products processed in plants to account for the amount of milk bought by plants from milk centres Supply chain model 2. Dairies mass balance equations 1. Mass balance equations of the subsystems dairies – markets and dairies – milk centres , , , Constraints 2. Markets and Milk distribution centers constraints 1. Product portfolio feasibility constraints Results Multi-objective function Profit of Dairy complex Index of customers’ demand satisfaction Index of milk venders’ satisfaction Pareto-Frontier contour plot This study was carried out by the financial support of Bulgarian NCSR- contract I-1404 and IX Commission for Scientific and Technical Cooperation between Spain and Bulgaria ESCAPE 17, Bucharest, Romania, May 27-30, 2007