Download
1 / 42
420 likes | 575 Vues
November 5, 2002. Residential Hot Water Heater Warranty Requirements. Background. Original “deemed” savings eligibility requirements did not specify warranty Standard electric resistance water heater assumed measure life = 10 yrs

E N D
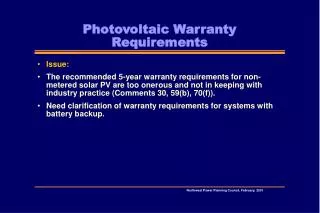
November 5, 2002 Residential Hot Water Heater Warranty Requirements
Background • Original “deemed” savings eligibility requirements did not specify warranty • Standard electric resistance water heater assumed measure life = 10 yrs • Measure life based on US DOE Technical Support Document for Water Heater Standards • “10 year warranty” requirement added to eligibility requirement as of October 1, 2002
Background - Continue • Utilities have raised several concerns • Warranty information is difficult to obtain from customers, since it is often not on tank label • Tanks with qualifying “EF” and 10-year warranties are not available in some areas and/or offered by some major suppliers • Tanks with 10-year warranties cost much more ($100) than those that meet the EF requirement, but without long warranties
Measure Life Assumptions for Electric Water Heaters Generally Exceed 10 yrs Appliance Magazine (09/2000) Survey of manufacturers, not field data) • Minimum life – 6 yrs • Average life – 14 yrs • Maximum life – 21 yrs True, Robison & Cohan (1996) Based on sample of“failed tanks” returned to plumbers in PGE territory • Median life – 14.6 yrs BPA Measure Life Study (1994) • 15 yrs • NWPPC Plan (1995/1996 • 12 yrs
Measure Life vs. Warranty Life • GAMA Directory lists longer warranty periods for tank models with two anode rods • Not all tanks with qualifying EFs have two anode rods • “Assumed” measure lives exceed 10 year warranty period
November 5, 2002 Can We Establish Deemed Savings for Programmable and Electronic Thermostats
Programmable Stats – The Promise • “ENERGY STAR estimates that ENERGY STAR labeled programmable thermostats, when used properly, can save consumers 20-30% on heating and cooling bills.”Source: http://yosemite1.epa.gov/estar/consumers.nsf/content/prgtherm.htm#therm • “Saving 15 to 75 percent on your heating and cooling costs—while maintaining your home’s comfort—is easier than you ever imagined. You can do it simply by using a setback thermostat.” Source: http://www.energy.ca.gov/efficiency/home_energy_guide/SETBACK_THERMOSTATS.PDF • Would you like to lower your heating and cooling costs by 10 percent? All you need is a programmable thermostat - it automatically sets back the temperature in your home to preset levels at different times of day. Source: http://www.powerhousetv.com/savingenergy/products/heat_cool/thermostats.php3
Programmable Stats – The Reality • “Before we did this study, I was sold on programmable thermostats. It was a shock to me when we discovered that they have virtually no effect on energy savings.” Source: Monic Nevuis, Wisconsin Energy Center. “An Unexpected Setback for Programmable Thermostats” Energy Design Update (11/2000). Conclusion based on survey of thermostat setting of 299 randomly selected single family home owners. Two-thirds had manual thermostats and one –third had programmable thermostats. PRISM analysis of energy bills showed no significant difference in consumption. The time weighted average self-reported thermostat setting for the homes with manual thermostats was 67.8 F while those with programmable thermostats had a weighted average setting of 67.7 F.
Programmable Stats – The Reality • “ . . . (we) found no statistically significant difference between the average (setback) values for those who set back manually versus those who used the automatic feature.” Source: David Cross and David Judd. “Automatic Setback Thermostats: Measure Persistence and Customer Behavior” Proceedings of the 1997 International Energy Program Evaluation Conference, Chicago, August 27-29, 1997.
Programmable Stats – The Reality • “Within our project, we had 19 homes with programmable thermostats that showed evidence of increased consumption and peak demand.” Source: Danny Parker, Florida Solar Energy Center. Energy Design Update (11/2000). Comment based on end use metering of 150.single family homes. Occupants with manual thermostats were also more likely to adjust their thermostat’s upward (to reduce air conditioning use) than those with programmable thermostats.
Programmable Stats – The Reality • “ . . . houses with programmable thermostats averaged only about a 1o F less than those with manual thermostats. This difference was not statistically significant. Energy savings from programmable thermostats are certainly overestimated and will be well below the 15% sometimes mentioned in promotional materials” Source: Craig Conner, Pacific Northwest National Laboratory. “Surprise! There Are People Inside Those Buildings” Energy Design Update (1/2001). Conclusion based on hourly end-use metering of energy use and temperature in 150 single family homes in PNW in ELCAP.
Programmable Stats – The Reality • “In general, savings are small and not statistically significant.” Source: David Robison, etal. “Comfort STAT Program Evaluation Final Report”. Prepared for EWEB. May 24, 2002.
The Evidence for Deemed Savings Electronic Line Voltage Thermostats
Technology Overview • Bi-metal, electromechanical line voltage thermostats are most commonly used with electric resistance heating systems – they are cheap and not very accurate. • Electronic thermostats cycle more frequently and tend to have a narrower temperature swings, providing greater comfort control and (sometimes) savings – More precise control can result in lower average temperature & energy use.
Summary of measured field savings from thermostat replacements Measured field savings range from 0 to 12 percent. • Hydro-Québec • Trois-Rivières 1 (N-23) Savings – 6.9% • Trois-Rivières 2 (N-12) Savings – 9.2% • Montreal South Shore 1 (N-23) Savings – 7.1% • Montreal South Shore 2 (N-7) Savings – 10.4% • EPRI-1 (PP&L) (N-1) Savings – 8.5% • EPRI-2 (PP&L) (N-1) Savings – 12.0% • Portland Energy Office (N-27) Savings - 0%
Summary of measured field savings from thermostat replacements – Cont. • Northeast Utilities Sub-metered Pre/Post Retrofits • 24 Single Family • 36 Multifamily • Average Energy Reduction was 7.1% across all homes • BUT . . . .
Summary of measured field savings from thermostat replacements – Cont. • Of 56 sites • 23 had statistically significant lower energy use • 10 had a statistically significant higher energy use (8 of these were multifamily) • 23 site’s energy use could not be correlated to thermostat replacement due to occupant behavior • Energy savings for single family average 8.5% • Energy savings for multifamily were not statistically significant.
Thermostat Issues • Do “savings” resulting from reduced temperature settings based on occupant interaction (whether automatic or manual) persist? • Do savings from “behavioral” changes (i.e., thermostat setpoints) qualify as conservation under the Act? • Is there sufficient evidence to establish deemed savings values for: • Programmable Thermostats? • Electronic Thermostats?
Showerheads Faucet Aerators Pipe Wrap Deemed Savings for Hot Water Savings Measures
Low Flow Showerheads • Historical Savings Assumptions • BPA (1995) – 7 year Measure Life • 275 kWh/yr for 2.5 gpm, utility installed • 430 kWh/yr for 2.0 gpm, utility installed • 220 kWh/yr for 2.5 gpm, customer installed • 340 kWh/yr for 2.0 gpm, customer installed • PGE – (Current) • 419 kWh/yr for 3.0 to 2.2 gpm
Low Flow Showerhead Issues • EPAC 1992 set maximum showerhead flow rate at 2.5 gpm. Oregon and Washington Code required these beginning in 1989/91. • Therefore, if a consumer replaces there showerhead, it must use 2.5 gpm or less. This means “expected measure life” of incremental savings is shorter. • Median expected life of showerheads is between 7 – 12 years. • This means that at least 50% of the showerheads already use 2.5 gpm or less. • AWWA Research Foundation (1999) showed end-use metering of almost 1200 homes indicated average showerhead flow rate of 2.1 gpm. • This means that 2.0 gpm or less showheads are required on average to produce savings.
Low Flow Showerhead Options • Option 1 - Establish “deemed savings” values • Require “pre-installation” flow-rate test • Use truncated measure life (3-5 years) to reflect existing federal standard. • Require use of 1.5 gpm or less showerheads • Do not permit “consumer installed” option • Option 2 – Drop showerheads from measure eligibility list unless flow rate is below 1.5 gpm. • Option 3 - ?
Faucet Aerator Issues • EPAC 1992 set maximum faucet aerator flow rate at 2.75 gpm. • Therefore, if a consumer replaces there faucet, it must use 2.75 gpm or less. This means “expected measure life” of incremental savings is shorter. • Median expected life of faucet aerators is between 7 – 12 years. • This means that at least 50% of the showerheads already use 2.75 gpm or less. • AWWA Research Foundation (1999) showed end-use metering of almost 1200 homes indicated average faucet flow rate of 1.35 gpm. • This means that 1.0 gpm or less faucet are required on average to produce savings.
Kitchen and Bathroom Faucet Aerators • Historical Savings Assumptions • PacifiCorp (Single Family) • One Kitchen + One Bath – 100 kWh, de-rated to 73 kWh/yr for persistence • PSE • One Kitchen + One Bath = 150 kWh • PGE • Kitchen – 32 kWh/yr • Bath – 21 kWh/yr • SCL • Bath – 35 kWh/yr • BPA (Multifamily) • Kitchen – 90 kWh/yr • Bath – 80 kWh/yr
Kitchen and Bathroom Faucet Aerators – Summary of Field Research • AWWA Research Foundation (Approx. 1200 homes, sub-metered fixtures in 1999) • 10.9 gals/day/capita over 8.1minutes/day/capita • 1.35 gpm average flow rate • Seattle Water Department (2000) – Single Family • Retrofitted 60 bathroom faucets w/ 1.5 gpm aerators and 27 kitchen faucets w/ 2.2 gpm aerators • Total water use decreased from 9.2 gals/day/capita to 8.0 gals/day/capita. Reduction was statistically significant. • Hot water use was also reduced, but reduction was not statistically significant.
Kitchen and Bathroom Faucet Aerators – Summary of Field Research (cont.) • BPA/SCL (1993) • Retrofitted 93 Multifamily units w/low flow showerheads, aerators and toilets • Sub-metered hot water on showers and aerators • Savings • Kitchen - 90 kWh/yr • Bathroom - 80 kWh/yr bath
Kitchen and Bathroom Faucet Aerators Deemed Savings Options • Option 1 – Do not accept savings from aerators unless they are documented using RTF Savings Estimation Protocols • Option 2 – Drop aerators from list of eligible measures • Option 3 – Establish deemed savings value for aerators for multifamily. • Option 4 - ?
Hot water heater pipe wrap • Historical Savings Assumptions • PGE (Engineering calculation) • R-3.76 on first 3 ft. of hot and cold pipes • 124 kWh/yr • BPA (Ek & Auberg, Laboratory Measurement (1984) • R-4 on 15 first ft. of hot and cold pipe • 69 – 78 kWh/yr (@ 80 OF delta T) • 0.1114 W/OF (0.0428 W/ OF if only first five ft. of pipe)
Hot water heater pipe wrap - Options • Option 1 – • Add deemed savings value for pipe wrap • Base savings on BPA laboratory measurements • Adjust delta-T to field data on ambient temperatures of tanks and tank water temperatures • PGE study 68-69 F w/ DHW tank @ 130 F = 61-62 F • ELCAP 74 F w/ DHW tank @ 137 F = 63 F = 60 kWh/yr w/R4 (nominal) 15 ft hot & cold = 20 kWh/yr w/R4 (nominal) 3 ft hot & cold
Hot water heater pipe wrap - Options • Option 2 – Maintain eligibility, but do not establish deemed savings • Option 3 - ?
Outlet Plate Gaskets Other Weatherization Measures (e.g. wall insulation, weatherstripping, caulking) Deemed Savings for Air Sealing Savings Measures
Current Status of Credits for Air Sealing • No “prescriptive” based savings are eligible for C&R Discount credits • Weatherization measures, such as wall insulation, which are known to reduce infiltration receive no credit for savings associated with reduced air leakage • Outlet gaskets & door/window weatherstripping are frequently recommended/installed as a “low-cost” air sealing measures
Estimating Energy Saving for “Prescriptive” Measures Appears Problematic • “Prescriptive” air sealing measures have not been shown to produce consistent reductions in air tightness • Home-to-home variations in leakage areas & locations are large • The contribution of window, door and outlet gasket leaks to total leakage area varies over a wide range. (e.g., leakage around outlets has been shown to vary by a factor of four)
Outlet Gaskets: One Estimate • PGE • 16 gaskets/house • Reduce ELA by 0.357 sq.in./gasket = total reduction of 5.7 sq.in. • Reduces 1400 sq.ft. house air leakage by 0.024 ach • Savings = 57 kWh/yr or 3.5 kwh/yr/gasket
Outlet Gaskets: Another Perspective • LBNL – • “Electrical outlets rarely contribute more than 1% of a homes total air leakage” • “Time and money are better spent on finding and fixing major leaks, such as around plumbing penetrations.”
Should the RTF Establish Technical Criteria? If so, what should they be? Green Tags
The Issue • Utilities may claim C&R Discount Program Credits for the purchase of “Green Tags” • Currently, only BPA and the Bonneville Environmental Foundation are listed as “approved” vendors • Other Vendor Sell “Green Tags” • Not all “Green Tags” are the same
Is There An Acceptable Alternative to Subcool/Superheat When Ambient Temperatures Are Below 55 F? Heat Pump Refrigerant Charge Testing During the Heating Season
Background • Current PTCS Specifications require that a Heat Pumps refrigerant charge be testing and verified as correct during the cooling season using “Check Me” or the ACRx (Honeywell) handtool. • When a heat pump installation takes place after ambient temperatures fall below 55 F (the lower bound for getting reliable tests), contractors must return in the Spring to verify refrigerant charge • Climate Crafters has asked that we assess whether an alternative testing procedure would be acceptable.
What We Know • Manufacturer’s do describe alternative methods for testing a heat pump refrigerant charge in the heating mode: • Measure total airflow & temperature split, calculate heat output and compare it to published performance data • Remove and “Weight-In” Refrigerant
What We Have Also Been Told • “During the heating season, the only way to ensure that a heat pump has the correct. refrigerant charge is to weigh it in. Attempting to charge or adjust a charge by any other method is futile.” – Howard Leonard, HVACR News. Leonard is president of Total Tech HVACR Training. • “In no case would I expect it (the refrigerant charge) to get within the 5% of the optimum efficiency, which is the goal of the cooling mode test.” – John Proctor
Preliminary Recommendation • Permit use of “weigh in” method only.