Uncertainty in forecasts
This document explores the impact of weather forecasts on electricity pricing, particularly during periods of extreme temperatures. High temperature forecasts can lead to increased electricity purchase costs for retailers, as they must hedge against potential price spikes. It discusses the utility of forecast verification data and the value of options like the 38°C call option, examining historical outcomes and average contributions. The analysis highlights issues in forecasting accuracy and the role of ensemble forecasting, along with applications in various sectors such as power generation, mining, and agriculture.

Uncertainty in forecasts
E N D
Presentation Transcript
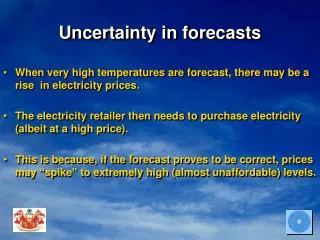
Uncertainty in forecasts • When very high temperatures are forecast, there may be a rise in electricity prices. • The electricity retailer then needs to purchase electricity (albeit at a high price). • This is because, if the forecast proves to be correct, prices may “spike” to extremely high (almost unaffordable) levels.
Impact of Forecast Accuracy • If the forecast proves to be an “over-estimate”, however, prices will fall back. • For this reason, it is important to take into account forecast verification data in determining the risk.
Using Forecast Verification Data • Suppose we define a 38 deg C call option (assuming a temperature of at least 38 deg C has been forecast). • Location: Melbourne. • Strike: 38 deg C. • Notional: $100 per deg C (above 38 deg C). • If, at expiry (tomorrow), the maximum temperature is greater than 38 deg C, the seller of the option pays the buyer $100 for each 1 deg C above 38 deg C.
Determining the Price of the38 deg C Call Option • Between 1960 and 2000, there were 114 forecasts of at least 38 deg C. • The historical distribution of the outcomes are examined.
Evaluating the 38 deg C Call Option (Part 1) • 1 case of 44 deg C yields $(44-38)x1x100=$600 • 2 cases of 43 deg C yields $(43-38)x2x100=$1000 • 6 cases of 42 deg C yields $(42-38)x6x100=$2400 • 13 cases of 41 deg C yields $(41-38)x13x100=$3900 • 15 cases of 40 deg C yields $(40-38)x15x100=$3000 • 16 cases of 39 deg C yields $(39-38)x16x100=$1600 Total 53 cases Total $12500 cont….
Evaluating the 38 deg C Call Option (Part 2) The other 61 cases (15+7+14+5+1+7+3+1+2+2+0+1+0+2+1), associated with a temperature of 38 deg C or below, yield nothing. So, the total is $12500 This represents an average contribution of $110 per case ($12500/[61 cases (38 deg C or below)+53 cases (above 38 deg C) ]), which is the price of our option.
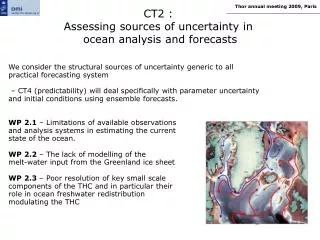
Ensemble Forecasting • Another approach to obtaining a measure of forecast uncertainty, is to use ensemble weather forecasts • The past decade has seen the implementation of these operational ensemble weather forecasts. • Ensemble weather forecasts are derived by imposing a range of perturbations on the initial analysis. • Uncertainty associated with the forecasts may be derived by analysing the probability distributions of the outcomes.
Some Important Issues • Quality of weather and climate data. • Changes in the characteristics of observation sites. • Security of data collection processes. • Privatisation of weather forecasting services. • Value of data. • Climate change.
Weather Derivative Applications • Several Case Studies in the Australia Market will be analysed including: Soft Drink Sectors Power Air Conditioning Theme Park Clothing Brewing Mining Ice Cream Gas Agricultural Weather Derivatives
Applications: Power (1) • "Earnings from Australian operations were lower primarily because of abnormally warm winter temperatures in Victoria that affected both electric and gas operations.” A utilities company in Texas, November 1999 • Demand for electric power is volatile, dependent upon numerous unpredictable factors, including the weather. New risk management tools can help power generators mitigate the impact of extreme weather conditions.
Applications: Power E.g. 1 (2) • A power generator can hedge its power price risk with a financial swap. However, it will incur an opportunity loss against the RRP (pool) price if temperatures in South Australia rise above normal during the peak cooling season (December - March). Source:EnronOnline
Applications: Power E.g. 1 (3) • Under such conditions, a generator would like to receive a higher price for its power, which it will already have hedged through an electricity swap. Source:EnronOnline
Applications: Power E.g. 2 (4) • A weather-indexed commodity swap can be structured to protect against such opportunity losses inherent in hedging programs. Source:EnronOnline
Applications: Power E.g. 2 (5) • The South Australian generator agrees to sell 60MW of flat power at a price of $50/MW for the month of February 2001. Having analyzed historical weather conditions, both parties agree on a trigger number of 110 cooling degree days for February. CDDs are calculated as the cumulative number of CDDs for the month of February. Source:EnronOnline
Applications: Power E.g. 2 (6) • Should the underlying weather conditions be warmer than the trigger, the power producer will be assured of receiving a higher price for its power. For every CDD per day above 110, to a limit of 200, the power company will be paid AU$0.10c/MW over the base price. Source:EnronOnline
Applications: Power E.g. 2 (7) • If the cumulative number of CDDs for February equals 125, the power company would receive AU$51.50/MW(AU$50 + AUD$0.10 x (125 - 110)). If the weather proves to be cooler than the strike of 400 CDDs, the generator will still be assured of a price of $50 per MW from the weather-indexed commodity swap. Source:EnronOnline
The increasing focus on weather risk • 3,937 contracts transacted in last 12 months (up 43% compared to previous year). • Notional value of over $4.3 billion dollars (up 72%). • Market dominated by US (2,712 contracts), but growth in the past year is especially so in Europe and Asia. • Australian market accounts for 15 contracts worth over $25 million (6 contracts worth over $2 million, previously). Source: Weather Risk Management Association Annual Survey (2002)
Survey Design and Implementation (1) • Presurvey (sent in February) • Sent to All WRMA members • Will you participate? 20 companies responded in 2002 (19 in 2001) • Survey (sent in April) • Establish size of market between April 2001 and March 2002 (Latest statistics) • 5 Pages in total (2 pages returned to PwC) • General information about company • Information on Contracts • Responses confidential and destroyed once tabulated Source: Weather Risk Management Association Annual Survey (2002)