Download
1 / 1
10 likes | 131 Vues
Gene signatures of pulmonary renal cell carcinoma (RCC) metastases predict metastases-free interval and number of metastases per patient. D. Wuttig 1 , M. Meinhardt 2 , S. Zastrow 1 , C. Hoefling 1 , B. Baier 3 , S. Fuessel 1 , M.-O. Grimm 1 , A. Meye 1 , A. Rolle 3 and M.P. Wirth 1

E N D
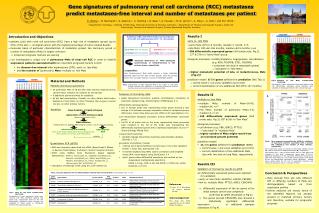
Gene signatures of pulmonary renal cell carcinoma (RCC) metastases • predict metastases-free interval and number of metastases per patient D. Wuttig1, M. Meinhardt 2, S. Zastrow 1, C. Hoefling 1, B. Baier 3, S. Fuessel 1, M.-O. Grimm 1, A. Meye 1, A. Rolle 3 and M.P. Wirth1 1 Department of Urology, 2 Institute of Pathology, Technical University of Dresden, Germany; 3 Department of Thoracic and Vascular Surgery, Center for Pneumology, Thoracic and Vascular Surgery, Coswig Specialised Hospital, Germany • Results I early vs. late Mets • early Mets: DFI=0-9 months, median=1 month, n=5 • late Mets: DFI=60-156 months, median=92.5 months, n=6 • 306 differentially expressed genes (414 probe sets; Fig.1), 27 & 279 in “early Mets” group biological processes: motility/migration, angiogenesis, cell adhesion (e.g. KDR, PDGFRB, ETS1, PECAM1) = processes involved in metastatic spread → “activated” in “late Mets” • higher metastatic potential of late, or metachronous, Mets (Fig.2)? • prediction model: 6/306 genes sufficient for prediction (WV, Tab.1) • → correct leave-1-out cross validation (p=0.002) • → correct classification of one additional Met (DFI=127 months) • Introduction and Objectives • patients (pts) with renal cell carcinoma (RCC) have a high risk of metastatic spread (up to 60% of the pts) urological cancer with the highest percentage of tumor-related deaths • molecular basis of particular characteristics of metastatic spread, like dormancy period or number of metastases (Mets) is largely unknown molecular prognosis markers are lacking • we investigated a unique tool of pulmonary Mets of clear‑cell RCC in order to identify expression patterns associatedwith two important prognostic factors in RCC: Prediction (KNN, 306 differentially expressed genes) of the DFI of 8 additional pts (DFI = 11–30 months) early Mets (DFI ≤9 months) late Mets (DFI ≥5 years) 1/8 Mets (DFI=15 months) 7/8 Mets (DFI=11-30 months) molecular differences of Mets developed synchronously or metachronously to the primary tumor, respectively • the disease-free interval after nephrectomy (DFI): early vs. late Mets • and the number of (pulmonary) Mets: multiple vs. few Mets supposition: Late (metachronous) Mets might develop a higher metastatic potential right from the start of their growth, since the primary tumor does no longer exist as a source of metastatic spread. • Material and Methods • Patients and tissue specimens • 20 pulmonary Mets of 18 pts with clear-cell RCC obtained during 1318nm-laser resection for analysis by microarrays • 9 additional pulmonary Mets for validation • all pts had nephrectomy, clinically no other distant Mets before diagnosis of lung Mets, no other therapies than surgery (except one pt), no other primary tumors Workflow Fig.3: Multiple vs. few Mets, unsupervised clustering. Visualization of gene expression (heat map) based on the 135 differentially expressed genes indicates their suitability to distinguish between the compared groups. Fig.2: Classification of eight additional Mets to the „early“ or „late Mets“ groups indicates the existence of molecular differences between synchronously and metachronously developed Mets. Analyses of microarray data • global background correction, quantile normalization, calculation of expression signals & log2 transformation (RMAExpress 4.1) differentially expressed genes: • one or several probe sets representing these genes showed a fold change ≥1.8 between average expression values of compared groups (MS Excel); t-test; false discovery rate (FDR)<0.05 (GenePattern 3.0) over-represented biological processes among differentially expressed genes: • ≥2.0% of all probe sets on the array representing these processes were included in the list of the probe sets representing the differentially expressed genes with a statistical significance of p<10-10 (Gene Ontology Mining Tool) • unsupervised clustering: • complete linkage hierarchical clustering using Euclidian distance (Genesis 1.7.2) • generation of prediction models: • minimal set of genes fulfilling a correct leave-1-out cross validation (Fisher´s exact test; GeneCluster 2.0) • k-nearest neighbouring (KNN; cosine correlation) and weighted voting (WV; mean‑based) using GeneCluster 2.0 • input: genes whose differential expression was verified by two independent mathematical algorithms: GCOS 1.4 (log2, FDR<0.05) and dCHIP 1.3 (PM‑only, outlier detection, p<0.05) • Results II • multiple vs. few Mets • multiple Mets: number of Mets=16-80, median=24, n=7 • few Mets: number of pulmonary Mets=1-8, median=3, n=10 • 135 differentially expressed genes (163 probe sets; Fig.3), 85 & 50 in “few Mets” biological processes: • cell division (e.g. PBK, BIRC5, PTTG1) → “activated” in “multiple Mets” • higher number of Mets might result from an increased growth potential prediction model: • 11/135 genes sufficient for prediction (KNN) • → correct leave-1-out cross validation (p<0.001) • → correct classification of two additional Mets • (pts with two and six lung Mets, respectively) snap-freezing in liquid nitrogen generation of cryo-sections (4µm) (tumor cell amount 70%) RNA isolation (RNeasy Mini Kit, Qiagen; RNA integrity number 4.5 for array processing) microarray processing (One-Cycle Target Labeling and Control Reagents Kit, HG‑U133 Plus 2.0 arrays, both Affymetrix) quantitative PCR validation • Quantitative PCR (qPCR) • RNA was reversely transcribed into cDNA (SuperScript II RNase H-Reverse Transcriptase, Invitrogen; random hexamer primers) • qPCR using TaqMan Gene Expression Assays (Applied Biosystems): BCMP11: Hs00411286_m1, CEACAM6: Hs00366002_m1, GALNTL2: Hs00365065_m1, HSPG2: Hs01078536_m1, PECAM1: Hs00169777_m1, PTTG1: Hs00851754_u1, reference gene TBP: Hs00427620_m1 • calculation of transcript levels using the DDCP method [1] PTTG1 GALNTL2 A • Results III • Validation of microarray results by qPCR six differentially expressed genes were selected for validation: • early vs. late Mets: GALNTL2, HSPG2, PECAM1 • few vs. multiple Mets: PTTG1, AGR3, CEACAM6 differential expression of the six genes in the initial sample cohort was completely confirmed by qPCR (examples in Fig.4) five genes (except CEACAM6) also showed a statistically significant differential expression in additional samples (examples in Fig.4) • Conclusion & Perspectives • Mets derived from pts with different DFI or differing numbers of Mets are distinguishable based on their expression profiles • further analyses will reveal, which of the identified features are already present in matched primary tumors and therefore, suitable for prognostic purposes Tab.1: Six gene signature for the differentiation between late and early Mets. {Fold changes (FC) = 2Dlog} n-fold expression related to a fictitious samples with DCP=0 B References [1] Livak KJ & Schmittgen TD (2001) Methods 25:402. . Fig.1: Early vs. late Mets, unsupervised clustering. Visualization of gene expression (heat map; columns and raws represent samples and probe sets, respectively) based on the 306 differentially expressed genes indicates the suitability of these genes to distinguish between the compared groups. early Mets late Mets multiple Mets few Mets Acknowledgement This study was kindly supported by the Dr. Robert Pfleger foundation. array results Fig.4: Gene expression quantified by qPCR for validation of expression patterns associated with a varying DFI (GALNTL2) and number of Mets (PTTG1), respectively. Gene expression values are shown for the initial sample cohorts (A) and for inclusion of additional samples (B), respectively. Fold changes (FC) = ratio of mean values “late vs. early Mets” and “multiple vs. few Mets”, respectively (array data: FC=2Dlog). Statistical significance of the expression differences measured by qPCR was determined by a two-sided heteroscedastic t-test based on the log2-transformed expression values. (Boxplots: median value, values within the 25. and 75. percentile, minimum and maximum expression value; n=number of Mets)