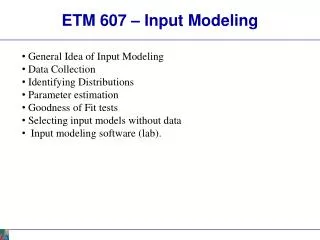
ETM 607 – Input Modeling
ETM 607 – Input Modeling. General Idea of Input Modeling Data Collection Identifying Distributions Parameter estimation Goodness of Fit tests Selecting input models without data Input modeling software (lab). ETM 607 – Input Modeling. Model Inputs. Model Logic. Model Outputs.

ETM 607 – Input Modeling
E N D
Presentation Transcript
ETM 607 – Input Modeling • General Idea of Input Modeling • Data Collection • Identifying Distributions • Parameter estimation • Goodness of Fit tests • Selecting input models without data • Input modeling software (lab).
ETM 607 – Input Modeling Model Inputs Model Logic Model Outputs • Model Inputs can be constants, but are typically random variables. • Input models can have a significant impact on model outputs and conclusions one draws from models. • Outputs are a result of simulation model. Inputs are typically collected and modeled by observing the real system or talking with “experts”. • See Jerry Mobley example.
ETM 607 – Input Modeling • General Idea • Observe process and collect data (or discuss with expert if data process or data not available). • Identify a probability distribution associated with collected data. Usually involves creating a histogram and matching to known pdf’s or using input modeling software. • Choose parameters for the selected distribution (e.g. mean, standard deviation, min, max, etc…) Parameters are an output from input modeling software. • Evaluate for goodness of fit.
ETM 607 – Input Modeling • How do you collect data? • Historical records • Stop watch and hours of observation • Standards • Expert advice • Others?
ETM 607 – Input Modeling • How do you collect data? • Examples from my recent experience • YKK MF1 Spooling Line – extensive data collection performed by intern the previous summer, and “expert” knowledge
ETM 607 – Input Modeling • How do you collect data? • Examples from my recent experience • Bassett Furniture – Door Assembly Department: Used extensive stopwatch time studies (I was being paid by the hour). • C130 PDM/HVM: Historical data and “expert” opinion.
ETM 607 – Fitting Distribution to Collected Data Creating Histograms: How do you create a histogram from collected data? Divide range of data into intervals (number of intervals rule of thumb: square root of sample size). Label horizontal axis to conform to the intervals selected. Count frequency of observations within each interval. Label the vertical axis so that the total occurrence can be plotted for each interval. Plot the frequencies on the vertical axis.
ETM 607 – Fitting Distribution to Collected Data Ink-Blot Test Suppose you collected and plotted the following. What distribution would you select? A - B - C - D - E -
ETM 607 – Input Modeling Ink-Blot Test Plots generated using Arena’s Input Analyzer. A - Triangular B - Exponential C - Normal D - Uniform E - Lognormal
ETM 607 – Input Modeling Ink-Blot Test How would you model the following data? Insert figure 9.1
ETM 607 – Selecting the Family of Distributions Which family of distributions fits your data (e.g. exponential, uniform, lognormal, beta, uniform, normal, etc…)? Ink-blot method using histogram of collected data. Good discussion on page 346-347 if histogram not available.
ETM 607 – Parameter Estimation Once a distribution is determined, how do you obtain the proper parameters? if grouped into k 2 Important Parametersfrequency distributions Sample Mean Sample Variance
ETM 607 – Parameter Estimation Suggested Estimators for Frequently Used Distributions Insert Table 9.3
ETM 607 – Goodness of Fit Tests How well does the observed data fit the distributional form you select? Interesting comment: “If very little data are available, then a goodness-of-fit test is unlikely to reject any candidate distribution; but if a lot of data are available, then a goodness-of-fir test will likely reject all candidate distributions.”
ETM 607 – Goodness of Fit Tests Chi-Square Test Already reviewed when evaluating Random Numbers. In general compares distributional histogram to observed histogram. Compare this sample statistic to critical values found in Table A.6. Where k is the number of cells, s is the number parameters in the hypothesized distribution. H0: The random variable, X, conforms to the distributional assumption with the parameters(s) given by the parameter estimate(s). H1: The random variable X does not conform.
ETM 607 – Goodness of Fit Tests Chi-Square Test - cont Finding Ei: When testing the Random number, R, we used where n is the number of observations and k is the number of cells. In general, where n is the number of observations and pi is the theoretical, hypothesized probability associated with the ith interval.
ETM 607 – Goodness of Fit Tests Chi-Square Test – cont Finding Ei: For discrete distribution, simply substitute the value for xiinto the pmf and calculate. For continuous distributions, for the cell/interval given by [ai-1 , ai] .
ETM 607 – Goodness of Fit Tests Chi-Square Test – cont Finding Ei: Alternatively, one could require a series of pivalues (that sum to 1.0) and determine the endpoints of each interval [ai, ai-1]. See example 9.18.
ETM 607 – Models when No Data is Available • How do you develop input models when no data is available? • Processes in design phase • Data expensive to collect • Rare occurrences • Triangular distribution (min, most likely, max) better than Uniform (min, max). • Obtain experimental results by making multiple runs with different input models to observe the sensitivity. • Normal distribution often satisfies customer.
ETM 607 – Input Modeling • Lab • Utilize Arena Input Analyzer