Download
1 / 18
180 likes | 380 Vues
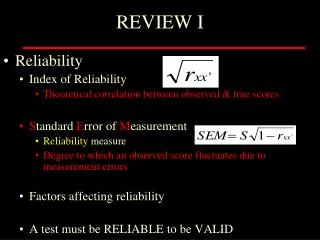
REVIEW I. Reliability Index of Reliability Theoretical correlation between observed & true scores S tandard E rror of M easurement Reliability measure Degree to which an observed score fluctuates due to measurement errors Factors affecting reliability

E N D
REVIEW I • Reliability • Index of Reliability • Theoretical correlation between observed & true scores • Standard Error of Measurement • Reliability measure • Degree to which an observed score fluctuates due to measurement errors • Factors affecting reliability • A test must be RELIABLE to be VALID
REVIEW II • Types of validity • Content-related (face) • Represents important/necessary knowledge • Use “experts” to establish • Criterion-related • Evidence of a statistical relationship w/ trait being measured • Alternative measures must be validated w/ criterion measure • Construct-related • Validates unobservable theoretical measures
REVIEW III • Standard Error of Estimate • Validity measure • Degree of error in estimating a score based on the criterion • Methods of obtaining a criterion measure • Actual participation • Perform criterion • Predictive measures • Interpreting “r”
Criterion-Referenced Measurement Poor Sufficient Better It’s all about me: did I get ‘there’ or not?
Criterion-Referenced Testingaka, Mastery Learning • Standard Development • Judgmental: use experts typical in human performance • Normative: theoretically accepted criteria • Empirical: cutoff based on available data • Combination: expert & norms typically combined
Advantages of Criterion-Referenced Measurement • Represent specific, desired performance levels linked to a criterion • Independent of the % of the population that meets the standard • If not met, specific diagnostic evaluations can be made • Degree of performance is not important-reaching the standard is • Performance linked to specific outcomes • Individuals know exactly what is expected of them
Limitations of Criterion-Referenced Measurement • Cutoff scores always involve subjective judgment • Misclassifications can be severe • Motivation can be impacted; frustrated/bored
Setting a Cholesterol “Cut-Off” N of deaths Cholesterol mg/dl
Setting a Cholesterol “Cut-Off” N of deaths Cholesterol mg/dl
Statistical Analysis of CRTs • Nominal data (categorical; major, gender, pass/fail, etc.) • Contingency table development (2x2 Chi2) • Chi-Square analysis (used w/ categorical variables) • Proportion of agreement (see next slide) • Phi coefficient (correl for dichotomous (y/n) variables)
Proportion of Agreement (P) Sum the correctly classified cells/total (n1 + n4)/n1+n2+n3+ n4 Examples on board
Considerations with CRT • The same as norm-referenced testing • Reliability (consistency)Equivalence: is the PACER equivalent to 1-mi run/walk? Stability: does same test result in consistent findings? • Validity (Truthfulness of measurement)Criterion-related: concurrent or predictive Construct-related: establish cut scores (see Fig. 7.3)
Day 1 Fail Pass Fail Day 2 Pass CRT ReliabilityTest/Retest of a single measure n1 n2 n3 n4 (n1 + n4)/(n1+n2+n3+ n4)
Criterion Fail Pass Fail Field Test Pass CRT Validity Use of a field test and criterion measure n1 n2 n3 n4
Example 1FITNESSGRAM Standards (1987) Below the criterion VO2max Above the criterion VO2max Did not achieve the standard on the run/walk test Did achieve the standard on the run/walk test P=(24 + 472)/(24+21+64+472) 496/581=85%
Example 2AAHPERD Standards (1988) Below the criterion VO2max Above the criterion VO2max Did not achieve the standard on the run/walk test Did achieve the standard on the run/walk test P=(130 + 227)/(130+23+201+227) 357/581=61% Compare Examples 1-2: F’gram(81%) better predictor of VO2max than AAHPERD standards (39%)
Criterion-referenced Measurement Find a friend: Explain one thing that you learned today and share WHY IT MATTERS to you as a future professional