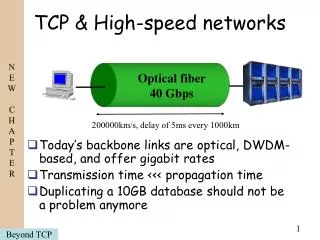
Download
1 / 32
320 likes | 482 Vues
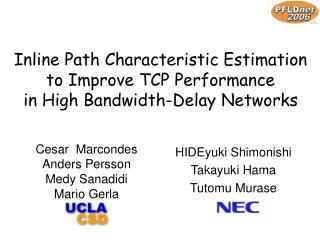
TCP Westwood and Easy Red to Improve Fairness in High-speed Networks. L. A. Grieco, S . Mascolo Dipartimento di Elettrotecnica ed Elettronica Politecnico di Bari, Italy PfHsn 2002 Berlin, 22 April 2002. Outline of the presentation. Overview of Reno and Westwood TCP congestion control

E N D
TCP Westwood and Easy Red to Improve Fairness in High-speed Networks L. A. Grieco, S. Mascolo Dipartimento di Elettrotecnica ed Elettronica Politecnico di Bari, Italy PfHsn 2002 Berlin, 22April 2002
Outline of the presentation Overview of Reno and Westwood TCP congestion control Mathematical model of TCP Westwood Easy RED Simulations of Reno, Westwood over drop tail, RED, Gentle Red, & Easy RED
Overview of Classic TCP (Reno) • Due to fundamental e2e principle the control must follow a trial and error AIMD paradigm with 2 phases: • I) A probing phase (additive increase), which aims at discovering the network available capacity • II) A multiplicative decrease phase triggered when congestion is signaled via timeout or duplicate ACKs
Reno TCP cwnd Fast recovery Linear increasing Timeout ssthresh Exponential increasing time Congestion Avoidance (CA) Slow-start (SS) Typical cwnd dynamics following the AIMD paradigm
Known drawbacks of Reno TCP • low throughput over wireless linksbecauselosses due tounreliable links are misinterpreted as congestion • Reno throughputproportional to 1/RTT, i.e. it is not that friendly
Overview of TCP WESTWOOD TCP Westwood is a sender-side onlymodification of TCP Reno based on: • window shrinking after congestion based on e2e bandwidth estimation (faster recovery) • E2Eestimation of available bandwidth filteringthe flow of returningACK packets
TCP Westwood cwnd Adaptive setting cwnd=ssthr=BWE*RTTmin ssthresh Timeout BWE*RTTmin time Slow start Congestion Avoidance The key point is theAIAD opposed to the AIMD paradigm : window shrinking after congestion is based on available bandwidth
E2E bandwidth estimation packets packets • The rate of returning ACKS is exploited to estimate the “best-effort” available bandwidth SENDER RECEIVER Network Filter Bandwdith estimate ACKs ACKs
bandwidth sample E2E ESTIMATE USING A TIME-VARYING FILTER • filtered value 1/F=Cut-off frequency
Pseudo-code • if (3 DUPACKs are received) ssthresh=BWE*RTTmin; cwnd = ssthresh; endif • if (timeout expires) ssthresh=BWE*RTTmin; cwnd = 1; endif
Equation Model of Westwood Assuming the following notation: • B: Bandwidth Estimate • p: segment loss probability • RTTmin: minimum Round Trip Time • RTT: Round Trip Time • cwnd: change of cwnd on update step
On successfully ACK reception (with probability1-p) the change in cwnd is (linear phase) cwnd=1/cwnd On segment loss (with probability p) the change in cwnd is cwnd=B RTTmin–cwnd
The expected value of cwnd is then Considering that r= cwnd/RTT and that the update timestep is RTT/cwnd: By separating variables and solving ……..
Friendliness to Reno If the loss probability is low, because of the flow conservation principle, the following approximation holds: By substituting the approximated bandwidth estimate into the previousEq. model, we obtain …….
The Westwood steady state throughput is : The Reno steady state throughput (Kelly’s model) is:
Both Westwood and Reno throughputs depend on: That is: they are friendly
Westwood throughput depends on: Reno throughput depends on: That is: Westwood improves fair sharing among flows with different RTTs
A “visive”look at fairnes. 40 cnx. over100Mbps bottleneck link Byte sent by 40 Reno cnx Byte sent by 40 West cnx
RED vs. EASY RED p p 1 Instantaneous Queue Length 0.1 Pdrop=0.01 Average Min_th Max_th. Queue Capacity min_th Queue Length RED Easy RED Average queue vs Istantaneous queue Varying pdrop vs Constant pdrop 4 parameters vs 2 parameteres
Rationale of Easy RED We believe that what the sender needs is just an early drop to promptly react to incipient congestion thus the queue should not be averaged because average introduces delay It is difficult to influence the sender behaviour via the dropping probability thus a constant dropping probability can be used The major gain from early drop can be obtained by changing the sender response to drop, that is using TCP Westwood
Ns-2 simulationssingle 100Mbps bottleneck shared by N TCP connectionsRTTs ranging from 250/N ms to 250ms D/S1 S/D1 100 Mbps R R D/S9 S/D9 D/SN S/DN
Jain Fairness Index vs. Number of connections sharing a 100Mbps bottleneck with Drop Tail 1 0.9 0.8 0.7 Fairness Indexes 0.6 0.5 0.4 0.3 0.2 Westwood Reno 0.1 0 0 20 40 60 80 100 No. of Connections
Average Throughput vs. Number of connections sharing the bottleneck (Drop Tail) 20 Westwood 18 Reno 16 14 12 Mbps 10 8 6 4 2 0 0 20 40 60 80 100 No. of Connections
Fairness Index vs. Number of Reno connections sharing the bottleneck with AQM 1 0.9 0.8 0.7 0.6 Fairness Indexes 0.5 0.4 0.3 No AQM 0.2 Easy RED RED 0.1 Gentle RED 0 0 20 40 60 80 100 No. of Reno Connections
Average Throughput vs. Number of Reno connections sharing the bottleneck with AQM 20 No AQM 18 Easy RED 16 RED 14 Gentle RED 12 Mbps 10 Easy RED/No AQM 8 6 4 2 RED/Gentle RED 0 0 20 40 60 80 100 No. of Reno Connections
Fairness Index vs. Number of Westwood connections sharing the bottleneck with AQM 1 0.9 0.8 0.7 Fairness Indexes 0.6 0.5 No AQM 0.4 Easy RED 0.3 RED 0.2 0.1 Gentle RED 0 0 20 40 60 80 100 No. of Westwood Connections
Average Throughput vs. Number of Westwood connections sharing the bottleneck (AQM) 20 No AQM 18 Easy RED 16 14 RED 12 Gentle RED Mbps 10 Easy RED/No AQM 8 6 4 2 RED/Gentle RED 0 0 20 40 60 80 100 No. of Westwood Connections
Friendliness Connections Fairness Index 100 West 0.78 50W 50Reno 0.64 100 Reno 0.51 70 West 0.79 35W 35Reno 0.66 70 Reno 0.31 40 West 0.84 20W 20 Reno 0.58 40 Reno 0.42 10 West 0.93 5W 5 Reno 0.65 10 Reno 0.3
Conclusions • TCP W exploits adaptive vs. multiplicative window reduction • Mathematical model of TCP Westwood shows that TCPW is friendly to Reno and provides significant fairness increment in high-speed Internet • Easy Red improves the fairnessof Reno connections wrt RED and Gentle RED • Easy Red improves the fairnessof TCPW connections wrt RED and Gentle RED