Download
1 / 29
400 likes | 805 Vues
III. Gathering weather data. One of the most common weather instruments is a thermometer , a device used to measure temperature. Barometers. Measures air pressure. In a mercury barometer, changes in air pressure are indicated by changes in the height of a column of mercury. Anemometer.

E N D
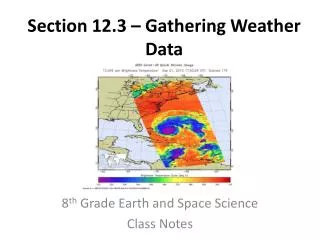
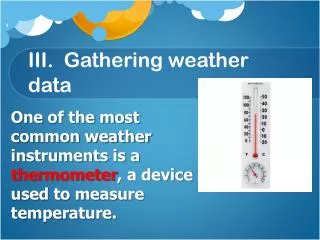
III. Gathering weather data One of the most common weather instruments is a thermometer, a device used to measure temperature.
Barometers Measures air pressure. In a mercury barometer, changes in air pressure are indicated by changes in the height of a column of mercury.
Anemometer Used to measure wind speed. Has cupped arms that rotate as the wind blows.
Hygrometer Measures relative humidity.
Automated Surface Observing System (ASOS) All of the devices you have learned about that collect weather data are considered “Surface Data.” The ASOS was established by the National Weather Service in the US to help forecast weather. This system gathers data in a consistent manner at regular intervals (about once an hour).
ASOS continued…. • In addition to the weather instruments already discussed, the ASOS uses a rain gauge for measuring rainfall as well as a CEILOMETER. • The Ceilometer measures the height of cloud layers and estimates the amount of sky covered by clouds.
Upper Level Data • Surface data is important but… • It’s equally if not more important to look at weather up to heights of 30,000 m. • In order to do this, we need better technology than the stuff we used for surface data!
Radiosonde This is the instrument of choice for measuring high weather. The radiosonde is a balloon-borne package of sensors.
Weather radar We need a weather radar to pinpoint where exactly rain is falling! Radar stands for “Radio detecting and Ranging.”
Doppler Radar • The doppler effect is the change in wave frequency that occurs in energy, such as sound or light, as that energy moves toward or away from an observer. • For example a train blowing it’s horn in front of you vs. after it has past you.
Weather Satellites • Takes photos of earth as it orbits around • The data is plotted on a map. • Tracks clouds but not precipitation.
Infrared Imagery • Detects differences in thermal energy, used to map cloud cover or surface temperatures. • In other words, it allows Meteorologists to determine the temperature of a cloud.
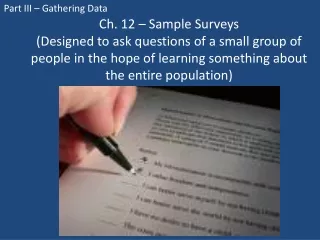
IV. Weather analysis Once weather observations are gathered, meteorologists plot the data on a map using station models for individual cities or towns. A station model is a record of weather data for a particular site at a particular time.
Surface Analysis While station models provide info for individual sites, isoplethsplot data nationwide or globally. Isoplethsare lines that connect points of equal or constant values.
Isopleths Continued… • The values represent different weather variables, such as pressure and temperature. • Lines of equal pressure are called ISOBARS. • Lines of equal temperature are called ISOTHERMS
ISOTHERM ISOBAR
Digital Forecasts • Main method used by modern meteorologists • Relies on numerical data
Analog Forecast • Compares current weather patterns to patterns that took place in the past. • Good for conducting monthly or seasonal forecasts.
Long term vs. short term forecasts • Long term forecasts are less reliable than short term forecasts. • The most accurate forecasts are short term. • Better forecasts up to 3 days • 4-7 day forecasts less and even more so with one to two week ranges.