Investigating AEG-1 Interactions and Akt Kinase Pathways in Cancer Cells
This study presents a series of supplementary figures illustrating the interactions between AEG-1 and Akt kinases, specifically focusing on Akt1 and Akt2 signaling pathways. The results, showcased in multiple figures, examine the impact of different siRNAs on AEG-1 expression and subsequent effects on phosphorylation levels of Akt and associated proteins over various time points. Notably, the analysis includes linear regression of phosphorylation half-lives and expression levels under various experimental conditions, providing crucial insights into the role of AEG-1 in tumorigenesis.

Investigating AEG-1 Interactions and Akt Kinase Pathways in Cancer Cells
E N D
Presentation Transcript
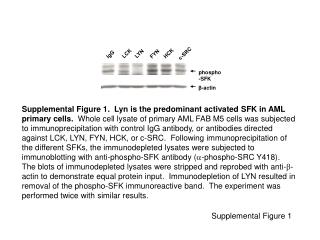
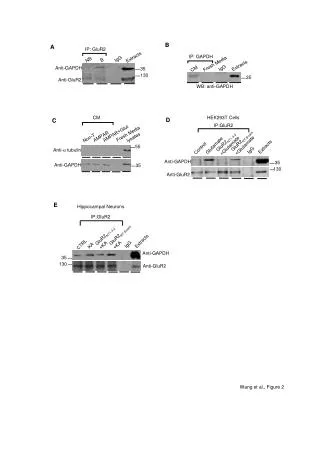
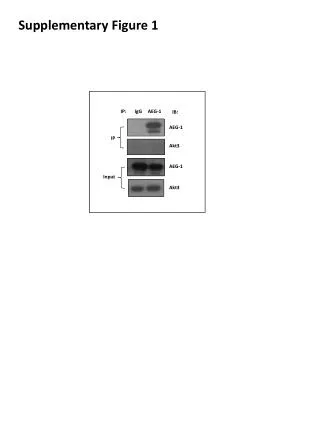
Supplementary Figure 1 IP: IgG AEG-1 IP IB: AEG-1 Akt3 AEG-1 Input Akt3
Supplementary Figure 4 A B Akt1-siRNA Akt2 -siRNA Ctrl -siRNA Akt1-PH+ AEG1 Ctrl siRNA Akt2-PH+AEG1 Vector Control AEG-1 — — + — + + Akt2-PH — + + — — — Akt1-PH — — — + + — AEG-1 AEG-1 — — + — + + Akt2-siRNA — + + — — — Akt1-siRNA — — — + + — Akt2-PH Akt1-PH AEG-1 Akt2 Myc tag AEG-1 AEG-1 p-Akt2-S474 p-Akt2-S474 Akt1 Akt2 Akt2 Akt2 Actin p-Akt-S473 Akt1 Akt1 ttAkt Actin Myc tag D C Actin Actin
Supplementary Figure 6 A 0’ 15’ 30’ 1h 2h 3h 0’ 15’ 30’ 1h 2h 3h 0’ 15’ 30’ 1h 2h 3h +LY294002: p-Akt S473 p-Akt T308 ttAkt Actin Control AEG-1 OE AEG-1-siRNA B Linear regression analysis of p-Akt S473 and T308 half-life
Supplementary Figure 7 AEG-1 — — — — + + + + Akt2-PH — + — + — + — + CAPE — — + + — — + + AEG-1 p-Akt2-S474 Akt2 p-P65 P65 Actin
Supplementary Figure 9 +LY294002: 0’ 15’ 30’ 1h 2h 3h Control AEG-1 OE p-Akt1 S473 AEG-1 KD Akt1 Actin