Download

1 / 18
180 likes | 288 Vues
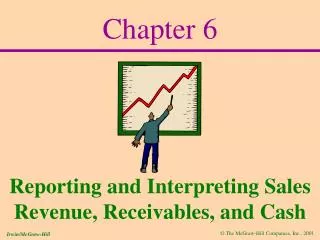
Reporting & Interpreting Cost of Goods Sold & Inventory. Libby, Libby & Short. So far we have learned that Assets are reported on the balance sheet representing economic resources owned by the company at a point in time.

E N D
Reporting & Interpreting Cost of Goods Sold & Inventory Libby, Libby & Short
So far we have learned thatAssetsare reported on the balance sheet representing economic resources owned by the company at a point in time. We have also learned that resources consumed by a company are shown on the Income statement as an Expense for a particular period of time. What happens when we consume our own assets? (i.e. utilize them ) As we consume them they are transferred from the balance sheet to the income statement.
Can you think of some examples? Pre-Paid Insurance Supplies Inventory Shown as an Asset while “waiting to be used” Expensed as consumed in operations Supplies Inventory Pre-paid Insurance Inventory (R/M, WIP, F/G) Supplies Expense Insurance Expense Cost of Goods Sold
Inventory Goods held for sale in the normal course of business (merchandiser) or goods which are used to produce goods or services for sale (manufacturer). Merchandise inventory is ready to be sold without further processing • Manufacturers Inventory can be identified by it’s stage of production • Raw Materials – product which will be utilized in the production process • Work In Process- goods in production but not yet completed • Includes Raw Materials, Direct Labor, Manufacturing Overhead • Finished Goods – completed goods ready for resale
When make a sale to a customer we have two separate transactions to record First- we must remove the inventory off our books (it’s been sold…we no longer own it). Inventory like any other asset is kept on the balance sheet at historical cost. Inventory is an asset We must debit it to remove it from our books What is the offsetting part of the entry? The cost of the inventory sold should be recorded as an expense on the income statement “cost of goods sold” is the title of the expense account used
When make a sale to a customer we have two separate transactions to record Second- We have made a sale to a customer….as such we need to record Revenue on our income statement The amount of revenue recorded is based on the price we have charged the customer (i.e. NOT historical cost) . Revenue shows up on the I/S and increases by a “credit” What is the offsetting part of the entry? It depends…have they paid us? If yes…record the cash If no…record the receivable
Due to the high volume of traffic on your street you decide to set up a lemonade stand. By the time you have purchased the lemonade, sugar & cups you determine that each cup of lemonade cost you 15¢. In your first day of business you sell all of your lemonade for a total of 50 cups. You charge 50¢ per cup of lemonade. How should we record these transactions?
Credit Debit Entry 1: Cash $25 $25 Lemonade Sale Revenue (To record proceeds from lemonade sales) Entry 2: Cost of Lemonade Sales $7.50 $7.50 Cash (To record the cost of the lemonade sold)
What is your profit on the lemonade stand? $25 Revenue (7.50) Less: Cost of Goods Sold Gross Profit $17.50 Other Operating Expense -O- $17.50 Net Income from Operations
What does your balance sheet look like? Assets Cash $17.50 Liabilities Owners Equity Retained Earnings (Earned Capital) $17.50
During the year we purchase new product and sell old product • 5/15 Purchased 4 Lincoln Town Car Automobiles • Blue Leather Interior $45,000 • Beige Interior $39,000 • Silver Blue with Sunroof $43,000 • Beige Leather Interior $47,000 • 6/24 sold Lincoln Town Car Blue Interior Serial # 4m459P • 7/4 sold Lincoln Town Car Beige Interior Serial #J6678P5 • 8/15 sold Lincoln Town Car w/ sunroof Serial # L7P54730 This situation is pretty straight forward but in real life we can’t always specifically identify our inventory….
When we can’t “specifically identify” our inventory units (i.e. imagine an inventory of steel beams) we must perform a “physical count” to determine how much inventory we have left. We know how much we had at the beginning of the year & how much new inventory we purchased…..using this we can calculate how much we sold Inventory Equation Beginning Inventory Purchases Goods Available for Sale (Ending Inventory) Cost of Goods Sold Go Over E7-1
#/Units Unit Price 1/1/02 Beg. Inventory 300 $12 2/15/02 Purchase #1 150 $11 7/20/02 Purchase #2 200 $12 10/15/02 Purchase #3 50 $13 12/31/02 End. Inventory 200 How many units did the company sell during the year? Beg. Inventory 300 + Purchases 400- Ending Inv 200= 500
#/Units Unit Price 1/1/02 Beg. Inventory 300 $12 2/15/02 Purchase #1 150 $11 7/20/02 Purchase #2 200 $12 10/15/02 Purchase #3 50 $13 12/31/02 End. Inventory 200 We sold 500 units….what should the dollar amount of COGS be for the year? In most cases, inventory is homogenous and individual units can not be specifically identified…. we must make assumptions about which units are being sold..
Two Cost Flow Assumptions FIFO- First-In-First-Out assumes that the oldest units (i.e. first in) are the first units “out” (i.e. sold…COGS) and the newest units (most recently purchased) are left sitting in inventory LIFO- Last-In-First-Out assumes that the newest units (i.e. most recently purchased) are the first units “out” (i.e. sold…COGS) and the oldest units (i.e. first in) are left sitting in inventory
#/Units Unit Price 1/1/02 Beg. Inventory 300 $12 2/15/02 Purchase #1 150 $11 7/20/02 Purchase #2 200 $12 10/15/02 Purchase #3 50 $13 12/31/02 End. Inventory 200 FIFO- First-In-First-Out Cost of goods sold (oldest units) 300 @$12 + 150 @ $11 + 50 @ $12 = $5,850 Ending Inventory is made up of: 150 @$12 + 50 @ $13 = $2,450
#/Units Unit Price 1/1/02 Beg. Inventory 300 $12 2/15/02 Purchase #1 150 $11 7/20/02 Purchase #2 200 $12 10/15/02 Purchase #3 50 $13 12/31/02 End. Inventory 200 LIFO- Last-In-First-Out Cost of goods sold (newest units) 50 @ $13 + 200@ $12 + 150 @ $11 + 100 @ $12 = $5,900 Ending Inventory is made up of: 200 @ $12 = $2,400
In periods of rising prices, cost of goods sold will be higher under LIFO than under FIFO, this makes sense….my newest (highest priced) items are considered sold first In periods of declining prices the opposite would be true.