Download
1 / 36
360 likes | 551 Vues
EWEC06 (2006.2.28, Athens). Numerical Site Calibration on a Complex Terrain and its Application for Wind Turbine Performance Measurements. Masatoshi FUJINO Daisuke MATSUSHITA Takanori UCHIDA Hikaru MATSUMIYA Masao WATANABE Yoshinori HARA Minori SHIROTA. Toshiyuki SANADA

E N D
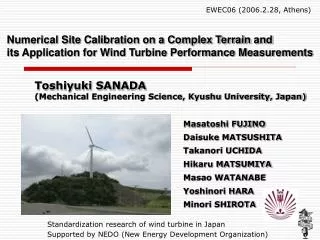
EWEC06 (2006.2.28, Athens) Numerical Site Calibration on a Complex Terrain and its Application for Wind Turbine Performance Measurements Masatoshi FUJINO Daisuke MATSUSHITA Takanori UCHIDA Hikaru MATSUMIYAMasao WATANABE Yoshinori HARA Minori SHIROTA Toshiyuki SANADA (Mechanical Engineering Science, Kyushu University, Japan) Standardization research of wind turbine in Japan Supported by NEDO (New Energy Development Organization)
EWEC06 (2006.2.28, Athens) Outline 1 A pair of masts Numerical Site Calibration Reference meteorological mast Wind Speed at a wind turbine Wind speed CFD (Computational Fluid Dynamics) Meteorological mast Fluid Dynamics Lab, Kyushu University
EWEC06 (2006.2.28, Athens) Outline 2 Flow Correction Factor due to Complex Terrain LES Prediction of wind speed GIS Meteorological mast Wind Turbine Performance Measurements
Introduction ~ Wind Turbine in Japan ~ Renewable energy 1.35% of total electricity supply(2010) Ratification of Kyoto Protocol Renewable Portfolio Standard (RPS) Law Wind power almost 1/10 of Germany’s !! March, 2004 926 MW 2010 3,000 MW (the official government target) 2030 11,800 MW (the new target of JWPA) Challenges for Japanese wind turbine development Complex terrain, Typhoon, Turbulence, Gust, Thunder storm …
Introduction ~ Wind Turbine in Japan ~ Wind Turbines in Japan Complex Terrain for Japanese wind turbine development mountain area 73%planes 14% 50% of the people live in plains. Wind Turbine Performance Measurements at Complex Terrain for next step… Prediction of wind power generation
Introduction Performance Measurements IEC61400-12-1 Example wind speed at reference mast= wind speed at wind turbine wind speed not influenced by wind turbine requirement of high accuracy in measuring wind speed
Introduction Site Calibration Complex Terrain Flow correction factor b (=the wind speed at the wind turbine location divided by the wind speed at the meteorology mast) Test site requirements(topographical variations) ・Maximum slope <5%(between 2L and 4L) ・Eliminate the direction > 0.02 in b between neighboring sector ・Each wind direction bin, no larger than 10° V1=bV2 IEC61400-12-1
Introduction Site Calibration Japan Wind Turbine Performance Measurements Imamura et al. (EWEC01) • Complex terrain that fails to satisfy the IEC standard • Two points correlation analysis (before WT is constructed) • Correlation equation using 10miniuts average. • Direction with high correlation • (eliminate the direction with high turbulent intensity) After measurements…., If there is no direction with high correlation? COST RISK
Objective • To propose anumerical site calibration, which employs CFD for wind field simulation over a complex terrain to evaluateflow correction factor.
Measurements Numerical Analysis Methods • To measure the wind speed at reference mast • To calculate the flow correction factor b using CFD • To correct the wind speed using b • To evaluate the wind turbine performance V1=bV2 V1=bV2
Numerical Analysis RIAM-COMPACT (Uchida & Ohya, 1999, 2003) Grid scale vortex : Navier-Stokes Eq. Sub-grid scale vortex : model LES (Large Eddy Simulation) Nonlinear, Unsteady simulation ! • time series analysis • correlation • turbulent intensity • etc…
Digital Map Wind turbine performance measurements Numerical simulation of wind turbine scale Digital map of wind turbine scale c.f. GSI map (50m, most commonly used) GIS (Geographic Information System) technique aero-photograph Printed atlas aero-photograph CAD data
Computational Grid 160 x 160 x 60
Test Site ~takashima~ N topographical variations fails to satisfy the IEC standard : test site requirement site calibration
Measurements Spatial configuration of WT & mast N L=5.13D mast1: reference mast mast2: for validity check
mast1 mast2 Wind Characteristics 1st, April, 05 ~ 30th, November, 2005 Wind Rose Average Wind Speed Average Turbulent Intensity [%] [m/s] [%] N NW, N, S
M1 WT N Correction Factor How to define the flow correction factor b? Example, North wind Condition: 5m/s, 10m/s, 15m/s, 10minuts • time series of wind speed of each points z=M1 mast 1 WT
Correction Factor How to define the flow correction factor b? • 10 minutes averaged value (corresponding to 10 minute data set) regression line (minimum mean square method) correlation coefficient : high However … Uncertainly analysis
(a) (b) Correction Factor Uncertainly analysis mast 1 WT Assumption: bivariate normal distribution u=N(0, s2): component of variation from average wind speed
Correction Factor How to define the flow correction factor b? • confidence interval 95% (±1.97s) evaluation of correction factor b error of UWT In this case, a=21% High accuracy in measuring wind speed is required. The power is approximately proportional to wind speed to the third power.
N NW Results ~NORTH WEST~ Flow Field y=WT y z M2 M1 WT Mast1 & WT: flow smooth mast2: large Uz components y=M2
N NW Results ~NORTH WEST~ Flow Correction Factor regression analysis b=1.059 a=0.6% Good direction for WT performance measurements
N NW Results ~NORTH WEST~ Validity Check validity check : mast 1 & mast 2 Measurements (10min data-set) Calculation cup vs. cup over estimation? y=M2
N N Results ~NORTH~ Flow Field Flow Field M1 M1 WT WT z=mast1 z=mast1
N N Results ~NORTH~ Flow Correction Factor regression analysis b=1.2241 a=21% Poor direction for WT performance measurements
N S Results ~SOUTH~ Flow Field Flow Field M1 WT y=WT z=WT WT
N S Results ~SOUTH~ Flow Correction Factor regression analysis b=1.0844 a=1.0% Good direction for WT performance measurements
Results ~SOUTH~ Validity Check What happen at the Mast 2 ? Turbulent Intensity WT M2 Siting of Meteorological mast a=53.0% !!
N NW Power Performance~ NORTH WEST ~
N N Power Performance~ NORTH ~
N S Power Performance~ SOUTH ~
Conclusion • A site calibration by employing CFD (LES and detail digital map obtained from GIS) is proposed. • A numerical site calibration can evaluate directional flow correction factor. • A numerical site calibration can be applied to the wind turbine performance measurements if terrain condition and flow direction are carefully chosen. • Using numerical simulation, the appropriate direction and position of meteorological mast for site calibration where fluctuation of wind speed is small, can be chosen.
For Future • Numerical site calibration at other sites. (validity check) • Measurements of wind turbine performance at complex terrain • (effects of flow distortion, turbulent intensity) • (For Japanese wind turbine development, a performance testing of WT at complex terrain is required for prediction of electric power generation)
N N Results ~NORTH~ Validity Check validity check : mast 1 & mast 2 Measurements (10min data-set) Calculation Measurements: north wind at mast1 = Calculation : north wind into island
N S Results ~SOUTH~ Validity Check validity check : mast 1 & mast 2 Measurements (10min data-set) Calculation Qualitatively good agreement