Download
1 / 31
340 likes | 737 Vues
Model selection in R featuring the lasso. Chris Franck LISA Short Course March 26, 2013. Goals. Overview of LISA Classic data example: prostate data ( Stamey et. al) Brief review of regression and model selection. Description of lasso. Discussion/comparison of approaches. Collaboration:

E N D
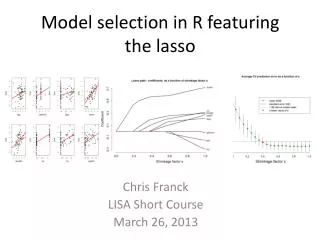
Model selection in R featuring the lasso Chris Franck LISA Short Course March 26, 2013
Goals • Overview of LISA • Classic data example: prostate data (Stamey et. al) • Brief review of regression and model selection. • Description of lasso. • Discussion/comparison of approaches
Collaboration: Visit our website to request personalized statistical advice and assistance with: Experimental Design • Data Analysis • Interpreting ResultsGrant Proposals • Software (R, SAS, JMP, SPSS...) LISA statistical collaborators aim to explain concepts in ways useful for your research. Great advice right now: Meet with LISA before collecting your data. Laboratory for Interdisciplinary Statistical Analysis LISA helps VT researchers benefit from the use ofStatistics LISA also offers: Educational Short Courses:Designed to help graduate students apply statistics in their research Walk-In Consulting: M-F 1-3 PM GLC Video Conference Room for questions requiring <30 mins Also 3-5 PM Port (Library/Torg Bridge) and 9-11 AM ICTAS Café X All services are FREE for VT researchers. We assist with research—not class projects or homework. www.lisa.stat.vt.edu
The goal is to demonstrate the lasso technique using real world data. • Lasso stands for “least absolute shrinkage and selection operator.” • Continuous subset selection algorithm, can “shrink” the effect of unimportant predictors, can set effects to zero. • Requires more technical work to implement compared to other common methods. • Note: The analysis closely follows Tibshirani (1996) and Friedman, Hastie, and Tibshirani (2009).
In addition to the lasso, these statistical concepts will be discussed. • Exploratory data analysis and graphing. • Ordinary least squares regression. • Cross validation. • Model selection, including forward, backward, stepwise selection and information criteria (e.g. AIC, BIC).
The prostate data originally described in Stamey et. al (1989). • 97 men who were about to undergo radical prostatectomy. • Research goal: measure association between cancer volume and 8 other clinical measures.
Regression brief review • Simple case: We wish to use a single predictor variable x to predict some outcome y using ordinary least squares (OLS). • E.g. x= lcavol, y=lpsa Quiz question 1:What do you see in the plot?
What important property does the regression line have? • Question 2: Why not use these lines?
The simple linear regression model is: • Which values are known/unknown? • Which are data, which are parameters? • Which term is the slope? Intercept? • Common assumption about error structure (Question 3: fill in the blanks): • ___(___,____) • Question 4: What is the difference between and ?
Frequently there are many predictors that we want to use simultaneously • Multiple linear regression model: • In this situation each represents the partial slope of predictor . • Question 5: Interpretation? • In our case we have 8 candidate predictors (see slide 7). Which set should we use to model the response?
Cross validation is used to determine whether a model has good predictive ability for a new data set • Parameter estimates are chosen on the basis of available data. We expect a good model to perform well on data used to fit (or ‘train’) the model. • Could your model perform well on new data (e.g. patients)? If, not, model may be overfit. • Cross validation: hold out a portion of the data (called validation set), fit model to the rest of the data (training set), determine if model based on training set performs well in validation set. • Metric to assess prediction error: Mean Square Error • , is predicted value of based on model.
Now complete code section 1 • Import the data to Rstudio. • View the data. • Plot the data, adding regression lines.
Variable subset selection uses statistical criteria to identify a set of predictors • Variable subset selection: Among a set of candidate predictors, choose a subset to include in the model based on some statistical criterion, e.g. p-values • Forward selection: Add variables one at a time starting with the x most strongly associated with y. Stop when no other ‘significant’ variables are identified
Variable subset selection continued • Backwards elimination: Start with every candidate predictor in the model. Remove variables one at a time until all remaining variables are “significantly” associated with response. • Stepwise selection: As forward selection, but at each iteration remove variables which are made obsolete by new additions. Stop when nothing new is added or when a term is removed immediately after it was added
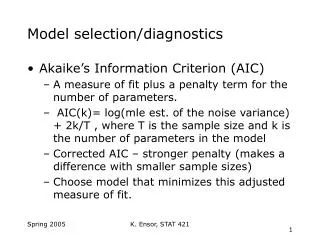
Full enumeration methods • Given a set of candidate predictors, fit every possible model, use some statistical criterion to decide which is best. • Where represents the likelihood function, k is the number of parameters. • Both of these criteria consider the likelihood of each model with a penalty for model complexity
MANY methods have been proposed to choose and use predictors • Shrinkage methods (Ridge regression, Garotte, many recent lasso-related developments) • Tree-based methods • Forward stagewise selection (different from forward stepwise regression) • Maximum adjusted or unadjusted , Mallow’s • Bayes Factor, Likelihood ratio tests • AICc, Deviance information criterion (DIC) • Many others!
The lasso algorithm performs variable selection by constraining the sum of the magnitudes of the coefficients Subject to . The lasso estimator minimizes the sum of squared differences between the observed outcome and the linear model so long as the sum of the absolute value of the coefficients is below some value .
Why constrain the sum of the absolute value of the coefficients? • We want a parsimonious model, or a model which describes the response well but is as simple as possible. • The lasso aims for parsimony using the constraint explained on the previous slide. • Since the overall magnitude of the coefficients is constrained, important predictors are included in the model, and less important predictors shrink, potentially to zero.
A few other important items An equivalent Lagrangian form of lasso: Many software packages require specification of Also, the shrinkage factor is defined by , which is between zero and one. Question: As (or ) increases, what happens to the coefficient estimates? Question: As increases, what happens to the coefficient estimates?
Now complete code section 2 • Fit the lasso model to the prostate data using the lars package • Plot the “lasso path” • Observe how the coefficients change as s increases. • Obtain estimated coefficients and predicted values for given values of s.
The least angle regression algorithm is used to fit the lasso path efficiently. • Extremely efficient way to obtain the lasso coefficient estimates. • Identifies the variable most associated with response (like forward selection), but then adds only ‘part’ of the variable at a time, can switch variables before adding ‘all’ of the first variable. • For more detail, see Efron et. al (2004) and Friedman et. al (2009).
The lasso path plot illustrates coefficient behavior for various . Question: How should we decide which to use?
Cross validation is used to both choose and assess predictive accuracy of model • Initial training and validation sets established. Tuning parameter s is chosen based on training set, model is fit based on training set. • Performance of the model chosen above is then assessed on the basis of the validation set. • Training model used to predict outcomes in validation set. MSE is computed. If training model produces reasonable MSE based on validation set, model is adopted.
K-fold cross validation splits data into • K=10. • Training set then broken into 10 pieces, 10-fold cross validation used to determine value of shrinkage factor . • Model is fit on entire training set at chosen , coefficients estimates stored, MSE computed.
Now complete code section 3 • Make a 10 fold cross validation ID vector • Make a vector of s values to use. • Perform 10-fold cross validation on the training set at the chosen values of s. • Determine which value of s minimizes 10 fold cross validation error. • Determine how well chosen model performs in validation set. • Compare performance of lasso with AIC, BIC
S is chosen to minimize MSE in the training set based on k fold cross validation • Picture is of average MSE based on 10 holdout sets for various values of s. • Vertical bars depict 1 standard error • Typically, value of s that is within 1 SE of lowest value is chosen. 10-fold cross validation suggests s=0.4 is a good choice.
Other interesting notes • Ridge regression is an earlier and similar method to the lasso, which invokes the constraint . • This is also a shrinkage or penalization method. • Ridge regression will not set any specified predictor coefficients to exactly zero. Lasso is preferable when predictors may be highly correlated. • For both ridge regression and lasso, cannot be estimated directly from the data using maximum likelihood due to an identifiability issue. This is why cross validation is chosen to fix at a constant.
Acknowledgements • Thanks to the following • Dhruva Sharma • Scotland Leman • Andy Hoege
References • Efron, B., Hastie, T., Johnstone, I. and Tibshirani, R. (2004). Least angle regression (with discussion), Annals of Statistics 32(2): 407-499. • Friedman, Jerome; Hastie, Trevor; Tibshirani, Robert (2009-02-09). The Elements of Statistical Learning: Data Mining, Inference, and Prediction, Second Edition (Springer Series in Statistics) (Kindle Locations 13024-13026). Springer - A. Kindle Edition. • Stamey, T., Kabalin, J., McNeal, J., Johnstone, I., Freiha, F., Redwine, E. and Yang, N. (1989). Prostate specific antigen in the diagnosis and treatment of adenocarcinoma of the prostate II radical prostatectomy treated patients, Journal of Urology 16: 1076-1083. • Tibshirani, R. (1996). Regression shrinkage and selection via the lasso. J. Royal. Statist. Soc B., Vol. 58, No. 1, pages 267-288).