Download
1 / 36
390 likes | 494 Vues
Explore sustainable development in industry integrating bioprocesses, biomass conversion, and cost assessment to optimize complex systems for triple bottom line success. Case studies and methodology included.

E N D
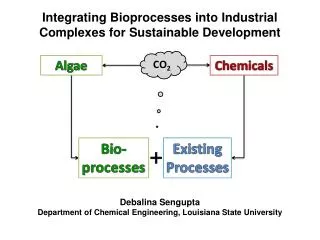
Integrating Bioprocesses into Industrial Complexes for Sustainable Development Debalina Sengupta Department of Chemical Engineering, Louisiana State University
Introduction • Sustainable Development • Overview • Biomass conversion designs • Superstructure formulation • Optimal complex • Case studies • Conclusions
Sustainability “Sustainable development is development that meets the needs of the present without compromising the ability of future generations to meet their own needs.” – Brundtland Report, United Nations There are numerous approaches to apply sustainable development by world organizations, countries and industries.
Life Cycle Assessment (LCA) Eco-Efficiency Analysis Sustainability Indicators: Metrics and Indices Industrial Ecology Carbon Dioxide Sequestration (CCS, bio-sequestration, chemical sequestration) Total Cost Assessment Methodology (TCA) (Economic Costs, Environmental Costs, Societal Costs)
AIChE Total Cost Assessment Methodology • Methodology developed by an industry group • Assesses economic, environmental and societal costs • Detailed report on total cost assessment (Constable et al., 1999). • Project Team • AD Little (Collab. & Researcher) Bristol-Myers Squibb • DOE Dow • Eastman Chemical Eastman Kodak • Georgia Pacific IPPC of Business Round Table • Merck Monsanto • Owens Corning Rohm and Haas • SmithKline Beecham (Lead) Sylvatica (TCAce Dev.) • TCA Users Group created in May 2009. Work is ongoing to update the costs identified in the report. Constable, D. et al., “Total Cost Assessment Methodology; Internal Managerial Decision Making Tool”, AIChE, ISBN 0-8169-0807-9, July ,1999.
Corporate Sustainability • A company’s success depends on maximizing profit • The profit equation expanded to include environmental costs and societal costs to meet the “Triple Bottomline” criteria Profit = Product Sales – Raw Material Costs – Energy Costs Triple Bottom Line = Product Sales + Sustainable Credits – Raw Material Costs – Energy Costs – Environmental Costs – Sustainable Costs Triple Bottom Line = Profit - Environmental Costs + Sustainable (Credits – Costs)
Industries in Louisiana • Petrochemical complex in the lower Mississippi River Corridor • Dow • DuPont • BASF • Shell • Exxon • Monsanto • Mosaic • Union Carbide …. and others Photo: Peterson, 2000
Objectives of Research • Identify and design new industrial scale bioprocesses that use renewable feedstock as raw materials with Aspen HYSYS® • Construct block models of bioprocesses for optimization • Integrate new bioprocesses into a base case of existing plants to form a superstructure of plants (using the chemical production complex in the Lower Mississippi River Corridor) • Optimize the superstructure based on triple bottomline • Obtain the optimal configuration of existing and new plants (chemical complex optimization) • Demonstrate use of the superstructure for parametric studies
Overview • Biomass based processes integrated into a chemical production complex. • Utilize carbon dioxide from processes in the integrated complex. • Assign costs to the Triple Bottomline Equation. • Mixed Integer Non-Linear Programming problem • maximize the Triple Bottomline • multiplant material and energy balances • product demand and raw material availability • plant capacities • Chemical Complex Analysis System used to obtain optimal solution to the MINLP problem (including Pareto optimal sets) • Monte Carlo simulation used to determinesensitivityof optimal solution to price of raw materials and products
Biomass Processes Biomass conversion processes designed for integration into the chemical complex • Fermentation • Anaerobic digestion • Transesterification • Gasification • Algae oil production Pretreatment of biomass is needed to make feedstock available for conversion to products Aspen HYSYS® - Process simulation Aspen ICARUS Process Evaluator® - Cost Estimation
Design Description of Transesterification Glycerol 4250 kg/hr 393 kg/hr • 10 million gallons per year 1 of Fatty Acid Methyl Ester (FAME) produced • FAME is utilized in manufacture of polymers • Glycerol is used in manufacture of propylene glycol Natural Oils 4250 kg/hr Methanol Transesterification FAME or FAEE 612 kg/hr 1 Design based on “A process model to estimate biodiesel production costs”,M.J. Haas et al., Bioresource Technology 97 (2006) 671-678
HYSYS Design of Transesterification Process Transesterification Reaction • Methyl ester purification • Glycerol recovery and purification
Design description of Propylene Glycol 246 kg/hr Hydrogen, 200oC, 200 psi • The design is based on a process for hydrogenation of glycerol to propylene glycol 1 • ~65,000 metric ton of propylene glycol is produced per year2 Glycerol Propylene Glycol 9,300 kg/hr 15,000 kg/hr 1 Design based on experimental results from Dasari, M. A. et al. 2005, Applied Catalysis, A: General, Vol. 281, p. 225-231. 2 Capacity based on Ashland/Cargill joint venture of process converting glycerol to propylene glycol
HYSYS Design of Glycerol to Propylene Glycol Hydrogenolysis Reaction Purification of Propylene Glycol
Process Flow Design to Block Flow Model for Optimization S3001 S3020 S3002 S3021 S3003 TRANSESTERIFICATION S3022 S3004 S3023 S3005 S3006
Plants in the Base Case • Ammonia • Nitric acid • Ammonium nitrate • Urea • UAN • Methanol • Granular triple super phosphate • MAP & DAP • Sulfuric acid • Phosphoric acid • Acetic acid • Ethylbenzene • Styrene
Integrated Chemical Production Complex Hydrogen,CO2 Biomass Complex Air, Methanol, Ammonia Base Case Complex
Raw Material Costs Profit Energy Costs Product Sales Environmental Costs Sustainability (Credits – Costs) Superstructure Chemicals like methylamines, methanol, acetic acid etc. from CO2 Algae growth for use as biomass CO2 Triple Bottom Line = Profit - Environmental Costs + Sustainable (Credits – Costs)
Superstructure Continuous Variables: 969 Integer Variables: 25 Equality Constraints: 978 Inequality Constraints: 91
Optimization Problem Maximize: Triple Bottom Line Triple Bottom Line = Profit - Environmental Costs + Sustainable (Credits – Costs) Subject to: Multiplant material and energy balance Product demand Raw material availability Plant capacities Optimal structure obtained by using Global Optimizers
Comparison of Base Case with Optimal Structure(Triple Bottomline)
Comparison of Base Case with Optimal Structure(Energy Requirement)
Comparison of CO2 use in Base Case and Optimal Structure Base Case Emission (million metric tons per year) : 0.75-0.14 = 0.61 Optimal Structure Emission (million metric tons per year) : 1.07-1.07 = 0 1.07 1.07
Multicriteria Optimization Problem Maximize: w1P+w2S P = S Product Sales – S Economic Costs – S Environmental Costs S = S Sustainability (Credits – Costs) w1 + w2 = 1 Subject to: Multiplant material and energy balance Product demand Raw material availability Plant capacities P=$1,194 M/yr S=$26 M/yr w1: 0.000-0.003 P=$1,346 M/yr S=$25.6 M/yr w1: 0.004-0.035
Sensitivity of Optimal Solution 20% probability of Triple Bottomline equal or below $1,650 million per year 80% probability of Triple Bottomline equal or below $2,150 million per year
Summary • Extend the Chemical Production Complex in the Lower Mississippi River Corridor to include: Biomass feedstock based chemical production CO2 utilization from the complex • Obtained the process designs and constraints • Assigned Triple Bottomline costs: Economic costs Environmental costs Sustainable credits and costs • Solved Mixed Integer Non Linear Programming Problem with Global Optimization Solvers to obtain optimal solution (including Pareto optimal sets) • Uses Monte Carlo Analysis to determine sensitivity of the optimal solution
Conclusions • Demonstrated a new methodology for the integration of bioprocesses in an existing industrial complex producing chemicals. • Five processes designed in Aspen HYSYS® and cost estimations performed in Aspen ICARUS®. • Three processes converted biomass to chemicals, and two processes converted the bioproducts into ethylene and propylene chain chemicals. • Fourteen bioprocess blocks were integrated into a base case of plants in the Lower Mississippi River corridor to form a superstructure. • Optimal configuration was determined by optimizing a triple bottom line profit equation. • Renewable resources as feedstock and carbon dioxide utilization had the triple bottomline profit increase by 93% from the base case. • Algae oil production and other chemical processes consumed all the pure carbon dioxide emitted from the complex. • Sustainable costs to the society decreased by 44% due to complete consumption of pure CO2. • Total energy required by the optimal complex was 6,405 TJ/yr. • Total utility costs for the complex increased to $46 million per year from $12 million per year in the base case.
Conclusions • Multicriteria optimization of the complex gave Pareto optimal solutions . A range of profit and sustainable credits/costs was obtained for a range of weights on the multiple objectives. • Monte Carlo simulations of the complex gave sensitivity of triple bottomline with respect to price of raw materials and products. • Five case studies demonstrated the use of chemical complex optimization for sustainability analysis. • The methodology could be applied to other chemical complexes in the world for reduced emissions and energy savings.
Recommendations • The methodology can be applied to other chemical complexes of the world. Plants in the Gulf Coast Region (Texas, Louisiana, Mississippi, Alabama) could be included in the base case. • Raw material availability constraints related to crop cycles and transportation costs can be included in the model (supply-chain). • Price elasticities can be used as leading indicators to estimate future prices of chemicals in the complex and have optimization over time periods. • HYSYS designs for algae oil production and gasification processes can be made when more data becomes available for these processes.
Acknowledgements • Dr. R. Pike, Dr. F.C. Knopf, Dr. J. Romagnoli, Dr. K.T. Valsaraj and Dr. J. Dowling • The Cain Department of Chemical Engineering, LSU for support • Tom Hertwig for industrial expertise • Lise Laurin (Earthshift) for Total Cost Assessment Methodology • Aimin Xu and SudheerIndala for the base case
Questions Comments