Download
1 / 21
210 likes | 317 Vues
Delve into the world of gamma-ray bursts (GRBs) and their radio properties with researchers from the Sydney Institute for Astronomy. Learn about the detection rates of intense bursts of gamma-rays associated with the core collapse of massive stars and the intriguing afterglows of GRBs. Discover how sensitivity limitations influence detection rates and the distribution of faint and bright GRBs. Explore the impact of redshift distribution on detection biases and the power of visibility stacking in measuring population flux. Uncover the existence of two distinct populations of GRBs, shedding light on intrinsic differences between radio bright and faint bursts. This research provides valuable insights into the nature of GRBs and their radio emissions.

E N D
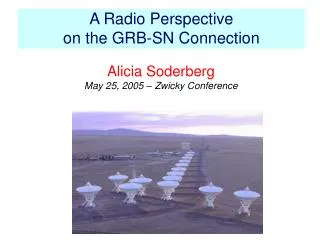
Radio faint GRB afterglows Sydney Institute for Astronomy (SIfA)/ CAASTRO – The University of Sydney Dr. Paul Hancockwith Bryan Gaensler, Tara Murphy, and DavideBurlon
Overview • Intro to GRBs • Radio properties of GRBs • Radio detection rate
Gamma Ray Bursts • Intense bursts of gamma-rays detected by satellites such as Swift / fermi • Associated with the core collapse of massive stars
GRB afterglows • Long GRBs associated with SNIbc T Totani Piran, 2003, Nature, 422, 268
Only 30% of GRBs are detected at radio frequencies • 304 GRBs observed (VLA+ATCA) • Only 30% have a detected radio afterglow • Detections and upper limits overlap in flux Bright GRB980703A "Typical" GRB980329A Days Since Burst Chandra&Frail 2012
Sensitivity limitations? • Assumption is that detection rate is a function of sensitivity. • Implicitly: • There is a single population of GRBs • Flux (Luminosity) distribution may be broad but is single peaked • Better sensitivity would result in more detections • Thus • The destinction between bright/faint is artificial • the mean flux of the faint GRBs is not far below this artificial divide
Parameter distributions No-Redshift Redshift Cumulative Fraction R-band optical flux (μJy) No-Redshift Redshift No-Redshift Redshift Gamma ray Fluence (erg/cm2) 0.3-10 keV X-ray Flux(erg/cm2/s)
Conclusion • The detection rate is NOT being biased by • Differences in redshift distribution • Our ability to measure redshift
Visibility stacking 1x 12 hour observation 12x 1 hour observations SNR ~ 1 SNR ~ 5 For a population of sources, visibility stacking can measure the (weighted) mean flux of the population. Hancock et al., 2011, ApJ ,735, L35
Stacking Results 100-1000 times brighter
Producing a model flux distribution Luminosity Models => Redshift Distribution => Flux Distribution
Stacked observations Consistent with predictions ~5x fainter than predictions
Two (more) populations of GRBs • Long-soft GRBs are either radio bright or radio faint • There are intrinsic differences between the bright and faint GRBs
A spectral break leads to dark/faint GRBs Greiner et al., 2010, A&A, 526, A30 Piran, 1999, Phys.Rep, 314, 575