Download
1 / 1
20 likes | 141 Vues
RAPID-SCAN DOW RADAR OBSERVATIONS OF TORNADOES DURING VORTEX2 2009 and 2010 Joshua Wurman , Karen Kosiba , Paul C. Robinson Center for Severe Weather Research. Rapid -Scan. DOW6.

E N D
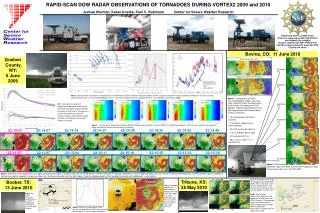
RAPID-SCAN DOW RADAR OBSERVATIONS OF TORNADOES DURING VORTEX2 2009 and 2010Joshua Wurman, Karen Kosiba, Paul C. Robinson Center for Severe Weather Research Rapid-Scan DOW6 Above: Wavelength analysis of the oscillations in tornado intensity (red line) as observed by the Rapid-scan DOW (blue line), indicating the dominant time scale is 1.21 minutes between 22:00 and 22:07 UTC. DOW6 Rapid-Scan Rapid-Scan DOW is an NSF facilityDOWs are supported by NSF-ATM-0734001 and -0966095 and -0946926 Analysis supported by NSF-ATM-0801041 VORTEX2 supported by SPO grant NSF-ATM-0724318 and others DOW7 DOW7 Observations: Green = DOW7 radius and locations Maroon = DOW6 Blue = Rapid-Scan Upgraded Rapid-Scan System Rapid oscillations resolved by Rapid-Scan, not by DOW-7 Bovina, CO: 11 June 2010 Goshen County, WY: 5 June 2009 DOW 6 at 0112:51 UTC 9730 MHz 6.2o Rapid-Scan DOW at 0112:55 UTC 9649 MHz 5.3o Rapid-Scan Observations Above. Seven-second observations of the Rapid-Scan DOW delta-V at three different elevations (left). An FFT analysis of channel 4 reveals periodic oscillations in tornado intensity approximately every 1.1-1.8 minutes (center). These ~ 1 minute oscillations are not captured by the 1-minute DOW7 observations (right). DOW7 Observations Above: Comparisons of DOW-measured Doppler velocity (left) and radar reflectivity (right) as observed by DOW 6 (top) and Rapid-scan DOW (bottom), indicating good agreement on both large-scale and fine-scale (black circles) circulations. 1.3 ° 0.5 ° 22:11:16 22:11:23 22:11:30 22:11:34 22:11:44 Left. Axisymmetric radial and tangential wind profiles derived from the Rapid-Scan DOW using the GBVTD technique at 130 m AGL. Divergence is present outside of the radius of maximum winds, while farther outside the radius of maximum winds weak inflow is observed. 9562 MHz 4.0o • Six simultaneous elevations scanned • Full volume updates every seven seconds. • 50 or 25-meter gate spacing • 0.8 – 0.9 degree beam width • 4D resolution @ 2 km • 28 m x 30 m x 25 m x 7 s = 150,000 m3s 9478 MHz 3.0o Above. Ground-based velocity track display (GBVTD) analyses derived from 7-second Rapid Scan DOW observations. Color contours indicate the tangential winds and vectors denote the secondary circulation. DOW7 13 km south 22:14:07 22:14:07 22:14:14 22:14:21 22:14:28 22:14:35 22:14:42 22:14:49 9354 MHz 1.3o Above: Time series of delta-V as measured by DOW 7 (green line) every one minute and Rapid-scan DOW (blue and red lines) every seven seconds. Note the periodic oscillations in tornado intensity that are captured by the Rapid-scan DOW, but not the coarser DOW 7 observations. 3.0 ° 4.0 ° 22:14:57 22:14:57 22:15:04 22:15:11 22:15:18 22:15:25 22:15:32 22:15:39 9310 MHz 0.5o Above: DOW-measured Doppler velocity (left) and radar reflectivity (right) from each channel of the rapid-scan radar. Time of observation was 01:09:20 GMT Above:Axisymmetric tangential and radial wind radial profiles derived from the rapid-scan radar using the GBVTD technique at 130 m AGL. Divergence is present inside of the radius of maximum winds, while farther outside the radius of maximum winds weak inflow is observed. Above: Evolution of the velocity (left, in images) and reflectivity (right, in images) from 2214:07-2115:39 UTC. DOW 7 (outlined in magenta) completes a volume approximately every one minute , whereas the Rapid-scan DOW (outlined in blue) completes a volume every seven seconds. Images are shown for the lowest elevation scan for both radars. Note the rapid evolution of the tornado that occurs on timescales of < one minute. Left: An example scan through the tornado by the Rapid-Scan DOW. Allfour elevations were taken at 23:40:39 UTC. Note the lack of the reflectivity eye at the four degree elevation scan. Right: Map detailing observations obtained by the Rapid-Scan DOW (blue) and DOW 7 (green). Circles denote radius of maximum winds observed by respective radars. Note the additional observations available from the Rapid-Scan DOW. Tribune, KS: 25 May 2010 Booker, TX: 13 June 2010 Left: An example Rapid-Scan observation of velocity (left) and reflectivity (right) at a single elevation angle. The structure of the inner debris ring is well captured. Right: The entire evolution of the Booker, TX tornado was captured by the DOW radar network. Above:Time series from the Rapid-Scan data of delta-V at 3 different elevations. Periodic oscillations in tornado intensity (arrows denoting peak measurements) are observed approximately every 1.25-1.50 minutes. Above: Delta-V as measured by DOW 7 (green) and Rapid-Scan DOW (red), capturing tornado genesis, intensification and demise. Combined DOW7 and Rapid-Scan measurements: Captured genesis and demise