Download
1 / 1
10 likes | 172 Vues
SH23A-0323 Development of a GLE Alarm System Based Upon Neutron Monitors T. Kuwabara (takao@bartol.udel.edu), J. W. Bieber, J. Clem, P. Evenson, R. Pyle, Bartol Research Institute and Department of Physics and Astronomy, University of Delaware.

E N D
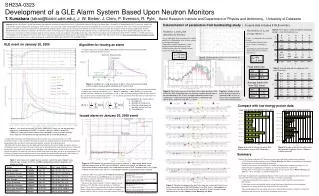
SH23A-0323 Development of a GLE Alarm System Based Upon Neutron Monitors T. Kuwabara (takao@bartol.udel.edu), J. W. Bieber, J. Clem, P. Evenson, R. Pyle, Bartol Research Institute and Department of Physics and Astronomy,University of Delaware Determination of parameters from backtesting study( ~5 years data includes 9 GLE events ) Abstract We have developed a system that watches for count rate increases recorded in real time by eight neutron monitors, and gives an alarm when a Ground Level Enhancement (GLE) is detected. In this work, we determine optimal strategies for detecting the GLE event at a very early stage, while still keeping the false alarm rate from glitches at a very low level. The January 20, 2005 event will be used to illustrate our methods. A reliable system is developed with an algorithm that produces alarms in three levels according to the number of stations showing an increase. We study past events to optimize appropriate intensity threshold values and a baseline to determine the intensity increase. At the highest level alarm produced by the three stations increase, a false alarm rate expected from the observed data during the past five years become zero. Alarm times of GLEs examined from the most recent nine events are compared with satellite proton data. The GLE alert would precede the earliest alert from GOES (100 MeV or 10 MeV protons) by ~10-20 minutes. For the January 20 event, the GLE alert (3 stations) was generated 12 minutes prior to the earliest GOES alert. The realtime GLE data may be viewed at http://neutronm.bartol.udel.edu/spaceweather. An automated e-mail alert system is under development. Supported by NSF grants ATM-0207196 and ATM-0000315. Table 2. False alarm number for different averaging periods tc and threshold levels Ith. Threshold level Ith and average minute tc Parameter tb and t0 that determine the baseline • Ith and tc are determined by a tradeoff between • avoiding false alarms (which • favors a large Ith and large tc) • and • generating the earliest possible • alarm (which favors a small Ith • and small tc) • Set tbsufficiently large to produce an acceptably small level of fluctuations in the Galactic cosmic ray background intensity. • Determine a suitable separation t0 of the baseline interval from the intensity at the evaluation point where the intensity increase exceeds 5% for the first time. GLE event on January 20, 2005 Algorithm for issuing an alarm Ith We define three levels of alarm (Watch, Warning, and Alert) based on the number of stations that record a significant intensity increase. tb=75 min t0 =10 min Ith=4% tc =3 min Figure 4. Standard deviation of the cosmic ray intensity I(t) about the two parameters tband t0. t0 False alarm rate Table 3. Average elapsed times between GLE onset and alarm. Average alarm time from GLE onset Figure 2. Condition for issuing three levels of alarm. Intensity increase recorded at three stations during a typical (notional) GLE are illustrated. Ith A threshold level Ithis set for the cosmic ray intensity increase, and an alarm is generated when the number of stations that exceed the threshold level is 1 - Watch, 2 - Warning, 3 -Alert. Baseline to calculate the intensity increase is defined by two parameters tband t0. Then, by using a trailing moving average value for the current count rate, the intensity at time t = tis calculated each minute from the observed count rate N(t) averaged over the preceding tcminutes as… Figure 5. Count rate increase of the South Pole station during the GLE of 26 Dec. 2001. Black line show the intensity variation derived from a baseline defined as the 75 min. average fixed before event onset. Colored lines shows the intensity derived from t0=20min (green), 10min (blue), and 1min (red) with tb= 75min. Figure 6. Number of data points for which intensity is reduced to 90% or less of the correct (fixed baseline) value at the evaluation point. Four parameters to issue the alarm tc : average time tb : duration of the base-line t0 : time interval between the baseline and current time Ith : threshold level t0 Compare with low energy proton data Lead time before SEC/NOAAProton Alert Lead time before Moderate Storm Issued alarm on January 20, 2005 event Figure 1. GLE event on January 20, 2005. Upper panel shows the low energy proton integral flux recorded by the GOES-11 satellite (solid line >10MeV, dotted line >100MeV). Lower panel shows neutron rates detected in several neutron monitors. These data are normalized to average counting rate at Inuvik (05:30-06:30). Largest GLE (Ground Level Enhancement) in half a century was occurred on January 20, 2005. As shown in Figure 1, the start time of the intensity increase in neutron monitors is earlier than that of the low energy proton flux, and time to reach maximum intensity is shorter for neutron monitors. The GLE particles have large mean free paths and travel almost at the speed of light, and can be detected with high accuracy by detectors with large volume such as ground-based neutron monitors. Then a GLE alarm can provide a very useful early warning of an impending solar radiation storm. In this work, we develop a system that watches for count rate increases recorded in real time in our data, and gives an alarm when a GLE is detected. Though, real-time alarm system of solar radiation storm are already operated by SEC/NOAA by using the GOES proton data, alarm time produced in our system will be compared with these. Figure 8. Number of Minutes by which GLE Alert precedes earliest SEC Proton Alert Figure 9. Number of Minutes by which each alert precedes Moderate Storm (>100pfu in >10 MeV channel) Summary • We have developed a real-time GLE detection system using eight high-latitude neutron monitors • GLE alarms are produced at three levels (Watch, Warning, and Alert) corresponding to the number of stations that exceed the 4% intensity threshold • Intensity increase are calculated from a 3-minute moving average counting rate relative to a 75-minute baseline extending from 85 minutes to 10 minutes before the current time • During the 4.4-year period of our backtesting study, the false alarm rate for Watch, Warning, and Alertwas ~40/yr, less than 1/yr, and 0/yr respectively • Alert times decided from this algorithm in the past 9 GLE events were compared with the earliest alert issued by SEC/NOAA based upon GOES (100 MeV or 10 MeV protons) data • Alert times produced by our system are ~10-30 minutes earlier than alert issue times from SEC/NOAA • Alert times are also substantially earlier (around 60 minutes) than the time when dangerous amounts of low energy particles reach the satellite (S2 storm level) • These results suggest that our system can provide valuable added minutes of advance warning for radiation events of concern for satellites, astronauts, and air crews. Table 1. Information on the eight neutron monitors used in this work. Station name, detector type, average count rate (at 2005), geographical latitude, longitude, and altitude are listed. Figure 3. GOES proton flux and cosmic ray intensity increase. In upper panel, black arrows indicate the onset time of SEP event(>100 MeV), and the start time of the Moderate storm. Vertical lines drawn in lower panels also show the onset time of GLE. Colored arrows in this Figure indicate the time when each alarm is issued (proton monitor) or generated (neutron monitor). Space Weather Message Code: ALTPX2 Serial Number: 27 Issue Time: 2005 Jan 20 0702 UTC ALERT: Proton Event 10MeV Integral Flux exceeded 100pfu Begin Time: 2005 Jan 20 0701 UTC NOAA Scale: S2 - Moderate On Jan 20, 2005 event, alarm time for Warning and Alert are 6:49 and 6:50 respectively, and Watch alarm is not generated. SEC alert are issued on 7:02 from >10 MeV data, and 7:04 from >100 MeV data (right box). The proton flux observed in the >10 MeV channel exceeds 100 pfu at 6:55. This flux level is defined as a “Moderate Storm” (S2 on NOAA Space Weather Scale for Solar Radiation Storms) that has the possibility to cause single-event upsets aboard satellites, and our system can produce alarm before this. Space Weather Message Code: ALTPC0 Serial Number: 17 Issue Time: 2005 Jan 20 0704 UTC ALERT: Proton Event 100MeV Integral Flux exceeded 1pfu Begin Time: 2005 Jan 20 0701 UTC Figure 7. Comparison between the alert times from our system with alarm issue times from proton data at SEC/NOAA about nine GLE events. Colored point on the time axis show the onset time of events and alarm timings for each energy (black-event onset, blue-Watch, yellow-Warning, red-Alert). http://www.sec.noaa.gov/alerts/archive.html