Download
1 / 37
370 likes | 544 Vues
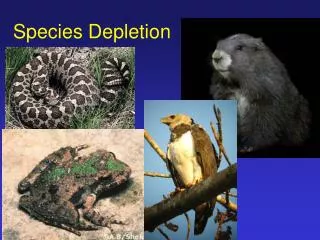
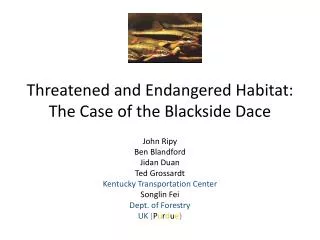
Threatened and Endangered Habitat: The Case of the Blackside Dace. John Ripy Ben Blandford Jidan Duan Ted Grossardt Kentucky Transportation Center Songlin Fei Dept. of Forestry UK ( P u r d u e ). What is the Blackside Dace?. Project Goals.

E N D
Threatened and Endangered Habitat: The Case of the Blackside Dace John Ripy Ben Blandford JidanDuan Ted Grossardt Kentucky Transportation Center SonglinFei Dept. of Forestry UK (Purdue)
Project Goals • Determine a better way for the Transportation Cabinet to anticipate the location of T & E Habitat for purposes of avoidance in transportation planning.
Strategy • Explore two methods of prediction • Statistical, observation-based models • Rules-based models not requiring existing data for construction
Major Components of Study • Established relationship with KSNP as repository of data and professional knowledge about T & E species and habitat. • Retained Dept of Forestry Prof. SonglinFei as expert on statistical modeling of environmental niches. • KTC adapted existing rules-based archaeological predictive modeling approaches to habitat suitability modeling.
Tasks • Worked with KSNP to identify suitable observation data sets for Dr. Fei to use. • Used published research and KSNP expertise to devise rules-based approach to be applied to GIS. • Spent considerable effort translating rules-based themes into appropriate GIS coverages. • Provided same GIS coverages to Dr. Fei as used by rules-based approach. • Constructed models and coverages using both methods • Compared results for accuracy, coverage, etc using KSNP observation data
Executive Summary • Existing GIS data is not necessarily readily useful for habitat modeling needs • Because fairly detailed studies have been done on existing habitat for threatened species, rules-based approaches can be quite effective • Statistical models and simple rules-based models perform similarly within the spatial domain of existing observations • Unknown (yet) whether one or the other will perform better in “unsampled” areas • Rules-based models have the advantage of being potentially more useful under conditions of limited data (i.e. scarce species)
Initial Possible Habitat Factors • Tennessee Tech, Jones (2005) : • Gradient • Turbidity • Dissolved oxygen content • Water temperature • Conductivity • Percent riffle • Link magnitude (Stream order) • Black (2007): • Conductivity • Water temperature • Kentucky State Nature Preserve: • Riparian vegetation type and width • Presence/absence of predator fish • Density of bridges and culverts over the stream network • Riffle/pool ratio • Density of oil and gas wells in the watershed.
Selection Considerations • GIS available to support? • Relative importance • Efficiency of model (number of factors to accommodate)
Factors Chosen for Modeling • Gradient • Canopy • Riparian vegetation type • Water conductivity • Riparian zone width • Bridges/culvert density • Link Magnitude/Stream order
Gradient • Rationale: • Streams characterized by moderate to high gradient are not believed to be conducive to blackside dace habitation, as are streams of unusually low gradient. • Jones (2005), dace are most likely to inhabit streams of a gradient of one to six percent at the stream scale. • Mattingly (2005) blacksidedace were four times more likely to occur in streams of a crude gradient of one to six percent. • Cumberlands quite mountainous • GIS Preparation • Data acquired from the Kentucky Geospatial Data Clearinghouse • Derived from 10 meter DEMs and mosaiced together to form a single image. • Calculated by giving a single gradient value to the entire stream segment, based on the change in elevation from the beginning of the segment to the end.
Tools for Slope • What we used • Extract Values to Points (Spatial Analyst) • Calculate Geometry – Length (or ShapeLength) • What we thought about • Slope (percent) • Focal Statistics (Range) with pre-determined Neighborhood http://resources.arcgis.com
Extracting Data from Servers • Create Fishnet (Data Management) • Set cell size to constraints of server limits • Use a Cursor to loop through cells • Extract by mask (for each cell) http://resources.arcgis.com
Canopy • Rationale: • Believed to directly impact the water temperature • Temperature a critical component of dace habitats (Black 2007; Black and Mattingly 2007; Jones 2005). • Black (2007): Temperature one of the most significant predictive factors for blackside dace presence/absence.
Tools for Canopy • Image Analysis • Band Arithmetic function • NDVI method • Normalized Difference Vegetation Index • Extract Bands • Calculate percentages with Map Algebra http://resources.arcgis.com
Riparian Vegetation • Rationale: • Essential role in water quality and habitat maintenance within an ecosystem (Naiman, Decamps, and Pollock 1993). • Filter out pollutants and other sediments, minimize flood events and regulate water temperatures.
Mine Density • Rationale: • Strip mining a major cause of habitat degradation and decreasing populations of blackside dace(Biggins 1988; Black and Mattingly 2007; Mattingly 2005; Wayne C. Starnes and Lynn B. Starnes 1978). • Increased specific conductivity of the water is, in effect, a function of the dissolved solids within the water, and it provides a useful measurement for understanding water quality (Wenner, Ruhlman, and Eggert 2003). • Increased conductivity levels are known to negatively and severely impact the habitat of blackside dace (Black and Mattingly 2007).
Mine Density http://minemaps.ky.gov
Riparian Zone Width • Rationale: • Characterized by vegetation type and width, height and bank slope (Delong and Brusven 1991). • Width indicates effectiveness of the riparian zone at filtering out pollutants and sediments and minimizing flood events. Developing Methods to Map the Region’s Riparian Areas – Ethan Inlander
Tools for Riparian Zone • Slope Degrees (less than 7) • Focal Variety (less than 5) • Path Distance (less than 225) • From streambed • Combine • Use the combined raster to clip the vegetation index to the riparian zone
Bridge / Culvert Density • Rationale • Limited mobility due to the lack of adequate connectivity of the stream network (Detar 2004) keeps Blackside Dace from reaching potentially suitable habitat. • Dams create large and deep pools with predator fish such as largemouth bass and redbreast sunfish (Mattingly 2005). • Roads over streams may yield poorly constructed culverts resulting in a small ‘waterfall’ as the water exits down the slope.
Link Magnitude / Stream Order • Rationale: • Stream order (also known as link magnitude) positively correlated with blackside dace presence/absence. • Jones (2005): stream order combined with connectivity the strongest predictive habitat model. • Blacksidedace prefer small to moderate streams (Detar 2004; O'Bara 1990). • Strahlerstream order captures the relative volume and accumulation of a stream segment within a network
Hydrology Tools 2 1 3 http://resources.arcgis.com
Weighted Overlay • GIS Layers • A single stream raster was created containing data for habitat factors conducive to predicting Blackside Dace presence along stream segments • Gradient • Stream Order • Canopy • Riparian Width • Land Cover
Statistical Approach • Used same GIS surface data as Rules-Based Model • Used 126 sites to build model, other 53 to test
New Study Area (includes only historical range of Blackside dace)