Download
1 / 15
150 likes | 298 Vues
Bio277 Lab 3: Finding Transcription Factor Binding Motifs. Adapted from a Lab Written by Prof Terry Speed Jess Mar Department of Biostatistics Quackenbush Lab DFCI jmar@hsph.harvard.edu. Outline. Analyze cell cycle gene expression data.

E N D
Bio277 Lab 3: Finding Transcription Factor Binding Motifs Adapted from a Lab Written by Prof Terry Speed Jess Mar Department of Biostatistics Quackenbush Lab DFCI jmar@hsph.harvard.edu
Outline Analyze cell cycle gene expression data. Cluster cell cycle data using hierarchical clustering. Visualize cell cycle clusters. Find motifs in these clusters and visualize them using sequence logos.
Cell Cycle Data Set Paper: Spellman et al. Comprehensive identification of cell cycle-regulated genes of the yeast Saccharomyces cerevisiae by microarray hybridization. Molecular Biology of the Cell, 1998, p3273. • Experiments assayed mRNA expression patterns over the duration of one cell cycle (at least). • Custom cDNA microarray platform. • RNA samples from Saccharomyces cerevisiae cell culture. • 3 methods of synchronization - -factor arrest, cdc15, elutriation. • Today's data:-factor arrest (blocks cell division in G1). • ~6000 genes x 17 times points • Sampled at 7min intervals over 120min, starting at time zero. • See http://cellcycle-www.stanford.edu
Experimental Data From the ~6000 yeast genes, we have chosen to focus on those involved in key biological processes (such as cell cycle, oxidative phosphorylation and nucleotide metabolism). Read the data into R: dat <- read.table("ccexpdata.txt", header=T, sep="\t") Objective: find transcription factor binding sites implicated in the cell cycle. • How do we search for these binding sites? • Where do we begin to search?
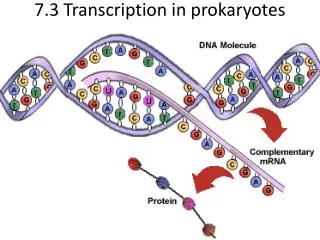
Linking Gene Expression and Promoters One canonical representation of gene regulation. Genes that are regulated by the same transcriptional program share similar expression patterns. But co-expression does not always imply co-regulation. We look to upstream promoter regions to see if we can elucidate common regular expression patterns. Statistically over-represented patterns are potential transcription binding sites.
Building Gene Expression Clusters distMat <- dist(dat, method="euclidean") clustObj <- hclust(distMat) plot(clustObj) How many clusters should we use? cluster.labels <- cutree(clustObj, 15) print(table(cluster.labels)) The cluster distribution looks like: barplot(table(cluster.labels), xlab="Cluster Size", ylab="Frequency")
Visualizing Clusters Let's plot the first 8 clusters: par(mfrow=c(2,4)) for( i in 1:8 ){ titleLab <- paste("Cluster ", i, sep="") expr.prof <- as.matrix(dat[cluster.labels == i,]) plot(expr.prof[1,], ylim=range(expr.prof, na.rm=T), type="l", xlab="Time", ylab="Expression", main=titleLab) apply(expr.prof, 1, lines) }
par(mfrow=c(2,4)) for( i in 9:15 ){ titleLab <- paste("Cluster ", i, sep="") expr.prof <- as.matrix(dat[cluster.labels == i,]) plot(expr.prof[1,], ylim=range(expr.prof, na.rm=T), type="l", xlab="Time", ylab="Expression", main=titleLab) apply(expr.prof, 1, lines) }
Exporting Expression Clusters Write out the gene names in each cluster into a text file: for( i in 1:15 ){ cluster.genes <- row.names(dat)[cluster.labels == i] fileName <- paste("cluster", i, ".txt", sep="") write(cluster.genes, fileName) } Are they there? dir()
Retrieving Promoter Sequences Let's focus on Cluster 12. We can retrieve the promoter sequences for these genes using a tool called RSA: http://rsat.scmbb.ulb.ac.be/rsat//RSAT_home.cgi When working on yeast genomics, another great resource is: http://www.yeastgenome.org/
TF Motif Finding Tools MEME http://meme.sdsc.edu/meme/meme.html AlignACE http://atlas.med.harvard.edu/cgi-bin/alignace.pl BioProspector http://ai.stanford.edu/~xsliu/BioProspector/
Making Sequence Logos WebLogo http://weblogo.berkeley.edu/logo.cgi SEQLOGO http://ep.ebi.ac.uk/EP/SEQLOGO/
TRANSFAC Database http://www.gene-regulation.com/pub/databases.html#transfac Database on eukaryotic cis-acting regulatory transcription factors. SITE: gives information on (regulatory) transcription factor binding sites within eukaryotic genes. GENE: explanation of the gene where a site (or group of sites) belongs to. FACTOR: describes the proteins binding to these sites. CELL gives brief information about the cellular source of proteins that have been shown to interact with the sites. CELL: gives brief information about the cellular source of proteins that have been shown to interact with the sites. CLASS: contains some background information about the transcription factor classes. MATRIX: gives nucleotide distribution matrices for the binding sites of transcription factors.
Public Data Repositories for Gene Expression Studies http://www.ebi.ac.uk/microarray-as/aer/?#ae-main[0] 2701 experiments available. Expression profiles derived from 180 experiments, 112 510 genes available. http://www.ncbi.nlm.nih.gov/projects/geo/ 3916 expression platforms. 174 783 samples.