Download
1 / 11
110 likes | 217 Vues
This study delves into the analysis of AFE board test data focusing on SVX gains measurements across channels, aiding in identifying faulty channels and certifying boards. It outlines the data collection process, gain calculation methods, and exclusion of problematic channels for accurate results.

E N D
Offline Analysis of AFE Board Test Data SVX Gains Pushpa Bhat, Rick Jesik, Andriy Zatserklyaniy September 25, 2001
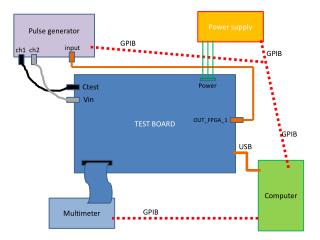
On each AFE board, 512 channels out of available 1024 channels are used (64 channels/MCM, 8 MCMs/board) • After the operating voltages are established for each SIFT in each of the MCMs, different amounts of charge are injected (QDAC=0 – 60, ~2.5 fCoulombs/QDAC unit) and SVX responses are read out. • For each channel then, we perform a linear fit to the SVX response @ QDAC=20, 30, 40, 50. The plots in the next few pages show the results of the fits to each of the channels across an AFE for a few boards. • Gain is one of the criteria to be used to define bad channels and in certification of the boards.
Gains in units of SVX counts/QDAC unit • Solid line is the average of values across the board (will look at • distributions, mean, mode and errors). • Dashed line is 75% of average value
Average gain doesn’t make sense when many channels or whole MCMs are bad! We will update code to exclude problematic channels.