Download
1 / 18
180 likes | 299 Vues
The Nunavik Lake Ice Service. S. Hughes 1 , A. Lewis 2 , O. Tsui 1 , J. Suwala 1 , A. Syed 1 , A. Dean 1 , T. Boivin 1 , V. Blazevic 3. 1 Hatfield Consultants, Suite 201-1571 Bellevue Avenue West Vancouver, British Columbia

E N D
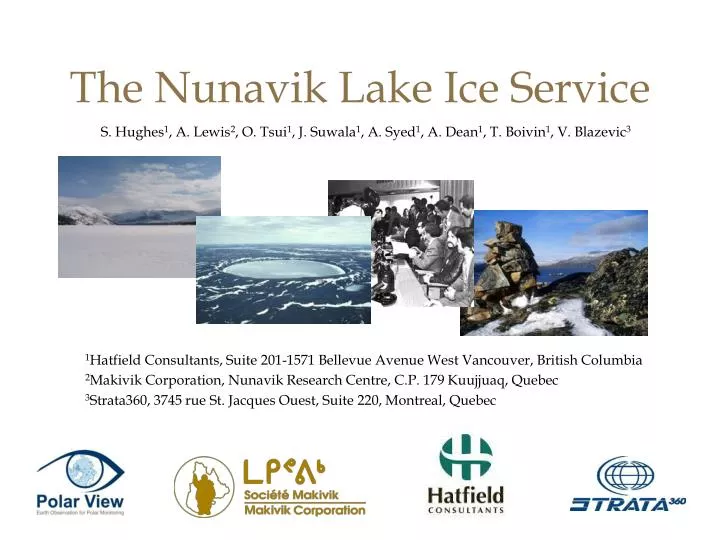
The Nunavik Lake Ice Service S. Hughes1, A. Lewis2, O. Tsui1, J. Suwala1, A. Syed1, A. Dean1, T. Boivin1, V. Blazevic3 1Hatfield Consultants, Suite 201-1571 Bellevue Avenue West Vancouver, British Columbia 2Makivik Corporation, Nunavik Research Centre, C.P. 179 Kuujjuaq, Quebec 3Strata360, 3745 rue St. Jacques Ouest, Suite 220, Montreal, Quebec
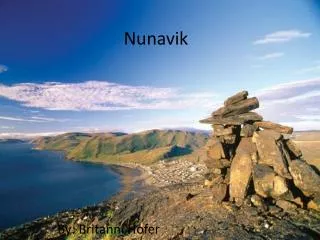
Nunavik • Sub-arctic / arctic territory in northern Quebec • Majority of land is tundra and taiga forest • 10,000 inhabitants of mostly Inuit descent • Bounded by the 55th parallel to the south, Quebec / Labrador border to the East, Hudson Bay to the West, Hudson Strait to the north • Over 660,000 km2 • Over 19,000 coastal islands
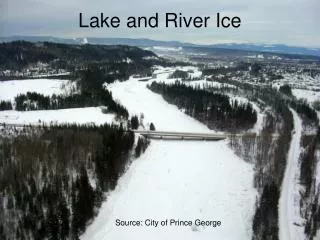
Background • Lake ice monitoring service under PolarView • Lake ice service provides regular updated information on ice conditions for specific regional lakes • Two Inuit communities who rely heavily on Arctic char for subsistence • Polarview Services include sea ice monitoring and forecasting, iceberg monitoring, ice edge monitoring, ice drift trajectories, river ice monitoring, lake ice monitoring, glacier monitoring, and snow monitoring • Population of Kangirsuk is around 400, and population of Kangiqsualujjuaq is approximately 650
Goals • Better management of Arctic char resources • Update the current TEK data • Introduce the benefits of EO data • Research staff & communities • Understand impacts of climate change on char overwintering habitat Arctic char, Tasikallak
TEK • Traditional Ecological Knowledge • Policy in Canada • Longer historical record than science • Differ in observational intensity and geographic coverage • May lead to separate conclusions • TEK has been defined as the knowledge claims of persons who have a lifetime of observation and experience of a particular environment, and as a result function effectively in that environment, but are untutored in the conventional scientific paradigm (Usher, 2000)
TEK Collection • Historical TEK collection through an interview process • Current use of internet using an online data collection system The Northern Village Data Collection System (NVDCS) was designed and developed by the Makivik Corporation It allows users to draw points, lines and polygons via an online map. After drawing is complete, an attribute form is filled in All of the data is submitted to the server, verified, and added to the over 86,000 spatial records that already exist in the TEK database
Sites • 100 km X 100 km • Important areas within the zones were identified by TEK and interviews with community representatives • Overwintering areas • Historical numbers of char • Changes have been noticed • Fish die-offs, freezing to the bottom The northern village of Kangirsuk
Technology • Ice conditions obtained from several data sources: • RADARSAT-1 Imagery • Envisat ASAR • Recorded and real-time weather conditions • Real-time ice profile data • Ground observations and TEK Satellite Linked HOBO weather station, Payne River
Data • Ice classification based on RADARSAT-1 imagery • 50 X 50 km, 8m res. • Data gaps filled with Envisat ASAR imagery • 100 X 100 km, 30 m res. • Too course • Some RADARSAT-1 images bumped Tasikallak, December 6, 2006
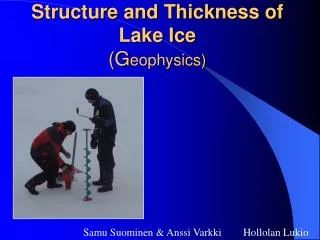
Data • HOBO weather stations • Temp, RH, Wind, Solar • Shallow water ice profiler (SWIP) • Phases (bursts & profiles) • Ice thickness (post process) • Data collection from Hunters • Ice & snow thickness • Monitoring equipment is configured to an Iridium satellite transceiver • The Iridium satellite constellation consists of 66 low-earth orbiting (LEO), cross-linked satellites operating as a fully meshed network and supported by multiple in-orbit spares. • It is the largest commercial satellite constellation in the world SWIP
Methods • Standard image processing steps • Speckle filter • Calibrate • Georeference • Manual interpretation • The Lake Ice Service provides approximate dates of freeze-up and break-up as CIS provides on the state of the Canadian Cryosphere (SOCC) website http://www.socc.ca/lakeice/lakeice_current_e.cfm • MANICE Manual (CIS) used to obtain correct terminology and colours for ice interpretation • Ice classifications: Open water, initial freeze-up, completely frozen, initial breakup
Product Delivery • Information delivery to local Inuit communities and hunters via an easy to use web-portal • Standard display of contextual information – climate data, ice thickness, etc. • Multi-year display of ice conditions • Users can input comments and/or observations • Multi-language • Lake Ice Service • http://nunavik.lakeice.ca • The Lake Ice Service is a part of a larger portal called the “Nunavik Project Portal” where we are attempting to identify all research throughout Nunavik in hopes of informing the communities more efficiently about the work being done in their traditional territory
Enhancements • Integration of EO and TEK • Geographic expansion • Sustainable funding • Training of hunters to collect additional samples • TEK collection using the NDVCS • Geographic expansion to the Nephijee system • We currently stock char from our hatchery • Multi-year fish counts of fish moving into the system from Ungava Bay • Fish tagging (U Waterloo) • Use a split beam sonar unit to “count” or monitor fish movement through key areas
For further information contact: Adam Lewis, Makivik Corporation, a_lewis@makivik.org Thomas Boivin, Hatfield Consultants, tboivin@hatfieldgroup.com