Genetic drift: evolution at random
Genetic drift: evolution at random. Genetic drift: evolution at random. Random chance versus deterministic effect Random genetic drift versus adaptive evolution Genetic drift as sampling error. 10.1 A possible history of descent of gene copies. History of genetic lines

Genetic drift: evolution at random
E N D
Presentation Transcript
Genetic drift: evolution at random • Random chance versus deterministic effect • Random genetic drift versus adaptive evolution • Genetic drift as sampling error
10.1 A possible history of descent of gene copies • History of genetic lines • Genealogy of genes coalesces to a single ancestor • The smaller a population, the faster coalescence occurs
10.1 A possible history of descent of gene copies • History of genetic lines • Genealogy of genes coalesces to a single ancestor • The smaller a population, the faster coalescence occurs • H = 2p(1-p) • Additional effects of mutation, gene flow and selection
10.2 A “random walk” (or “drunkard’s walk”) • Chance distribution due to neutral effects on fitness • Allele frequencies show a random walk pattern • Genetically identical subpopulations may develop strongly differentiated genetic reservoirs as a result of chance effects
10.3(1) Computer simulations of random genetic drift in populations • Computer simulation of random genetic drift in populations of 9 and 50 individuals during 20 generations • Fluctuations are stronger and alleles become lost or fixed more reapidly in small populations
10.3(2) Computer simulations of random genetic drift in populations • Computer simulation of random genetic drift in populations of 9 and 50 individuals during 20 generations • Fluctuations are stronger and alleles become lost or fixed more reapidly in small populations
10.4(1) Changes in the probability that an allele will have various possible frequencies • Distribution of allele frequencies among different populations of similar size N and with identical initial allele frequencies • After several generations, allele frequencies randomly drift towards 1 (fixation) or 0 (loss)
10.4(2) Changes in the probability that an allele will have various possible frequencies • Proportion of populations with different allele frequencies after t = 2N generations • Proportion of populations in which allele is fixed or lost increases at a rate of 1/4N per generation • Each class of allele frequencies between 0 and 1 decreases at a rate of 1/2N per generation
10.4(2) Changes in the probability that an allele will have various possible frequencies • Allele or haplotype frequencies fluctuate randomly • As a result, genetic variation at a locus decreases • Genetic drift can be measured by the level of heterozygosity • The probability of fixation of an allele is independent of previous shifts in its frequency • A proportion p of a set of populations with identical initial allele frequencies p will be fixed for that particular allele • A newly mutated allele with frequency pt = 1/2N has a chance equal to its initial frequency to become fixed; the probability of fixation increases with decreasing N • The average time to fixation for a new (neutral) allele is 4N generations (diploid population)
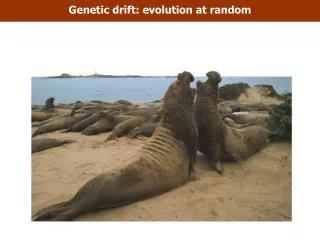
10.5 Effective population size among northern elephant seals is much lower than the census size • Effective population size Ne refers to the size of an ideal population (in which all individuals reproduce equally) which shows a similar degree of random genetic drift (measured as loss of heterozygosity) as the census population size
10.5 Effective population size among northern elephant seals is much lower than the census size • Variation in number of offspring reduces Ne • Deviation from 1:1 sex ratio reduces Ne • Natural selection reduces Ne • Strong overlap between generations reduces Ne • Fluctuations in population size reduce Ne
10.6 Effects of a bottleneck in population size on genetic variation, as measured by heterozygosity • Effect of bottleneck in population size on genetic variation • H decreases more rapidly with decreasing number of founders • H decreases more rapidly with decreasing increase in population size • Mutations create new genetic variation
10.7 Random genetic drift in 107 experimental populations of Drosophila melanogaster • Random genetic drift in 107 experimental Drosophila melanogaster populations (8 males + 8 females; heterozygote for bw/bw75) • Populations already start to vary in allele frequencies after 1 generation • First loss of allele bw75 after six generations • After 19 generations increasing loss/fixation of allele bw75
10.7 Random genetic drift in natural populations • Patterns of genetic variation in natural populations often match predictions made under the assumption of genetic drift • Differently-sized populations often show comparable mean allele frequencies, but variation mostly increases with decreasing size
10.8(1) Aggression and genetic similarity between Argentine ants • Aggression and genetic similarity between Argentine ants in relation to distance between colonies • Introduced populations in California show little aggression between colonies • Colonies in California show higher genetic similarity than those in Argentinia because the population is genetically more uniform due to founder effect
10.8(2) Aggression and genetic similarity between Argentine ants • Aggression and genetic similarity between Argentine ants in relation to distance between colonies • Introduced populations in California show little aggression between colonies • Colonies in California show higher genetic similarity than those in Argentinia because the population is genetically more uniform due to founder effect
Principles of neutral theory • Adaptive versus selective neutral genetic variation • High proportions of enzyme loci are polymorphic (Lewontin & Hubby 1966) • Neutral theory of molecular evolution (Motto Kimura 1968) • Although small minority of mutations in DNA are advantageous and are fixed by natural selection, and although many are disadvantageous and eliminated, great majority of fixed mutations are neutral with respect to fitness and fixed by genetic drift • Evolutionary substitutions proceed at roughly constant rate
Principles of neutral theory • Constant mutation rate uT(per gamete/generation) of which f0selective neutral • u0 = f0uT < uT(functional constraint) • Number of fixed neutral mutations per generation 2Neu0 x 1/(2Ne) = u0 • Fixation rate of mutations is constant and approximates the neutral mutation rate (4Ne generations to fixation) • number of base pairs difference: D = 2u0t
10.10 Number of base pair differences per site between mDNA of pairs of mammalian taxa • Number of base pair differences between mDNA of pairs of mammalian taxa in relation to divergence time • Difference increases linearly (5-10 mil year) before reaching an asymptote • Mutation rate calculated from linear part of curve (0.01 mut/base pair/lineage/year ( 10-8/year)
10.11 Equilibrium level heterozygosity at a locus increases as a function of the product of Ne & u0 • While the allelic composition continues to change, an equilibrium in allelic variation is eventually reached • At equilibrium: • Allozymen: u0 = 10-6/gameet; H = 0.004 (Ne =1000) en H = 0.50 (Ne = 250.000)
Reading • Page 238: Variation within and among species • Page 239: Do comparisons among species support the neutral theory?
Geneflow and drift • Rate at which a population drifts to fixation of an allele is inversely related to its effective population size • Genetic drift is neutralized by gene flow (with rate m) • At equilibrium: • Nm refers to the number of immigrants per generation: if m=1/N then Nm=1 and FST= 0.20 • Estimation of gene flow: • Assumes neutrality and hence equally affects all loci • Assumes equilibrium between gene flow and genetic drift
10.14 Geographic variation in allele frequencies at two electrophoretic loci in the pocket gopher • Geographic variation in allele frequencies at two electrophoretic loci in the pocket gopher • Large variation also between close locations (south-west VS and Mexico: FST = 0.412, Nm = 0.36) • Suggests low degree of gene flow
10.16 Homo erectus spread from Africa to Europe and Asia and evolved into H. neanderthalensis • Homo erectus dispersed ca. 1.8 mil years ago from Africa to Europe and Asia • Homo sapiens (other species) also originated in Africa and dispersed ca 100.000 year • This colonization involved a small Ne only (possibly < 12.000)