Download
1 / 29
300 likes | 374 Vues
Analysis of Sverdrup’s critical depth hypothesis and phytoplankton growth trends in the North Atlantic based on data from 1998 to 2006, challenging previous assumptions.

E N D
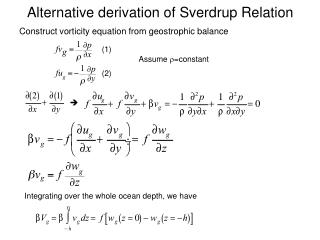
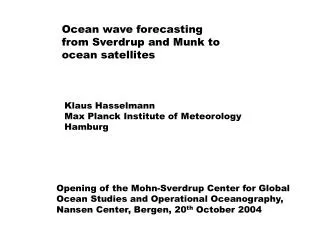
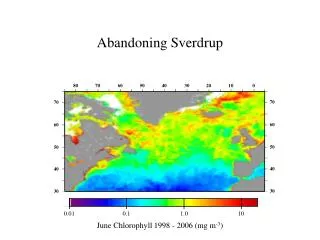
Abandoning Sverdrup 80 70 60 50 40 30 20 10 0 70 70 60 60 50 50 40 40 30 30 0.01 0.1 1.0 10 June Chlorophyll 1998 - 2006 (mg m-3)
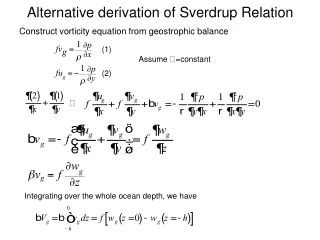
1953 Google citation count: 561 Net phytoplankton growth occurs when area acd > abdf
Sverdrup’s 1953 paper was a formalization of the ‘critical depth’ • concept originally proposed by Gran and Braarud in 1935* • The critical depth hypothesis attempts to explain what initiates a • vernal bloom, not what controls the magnitude of a bloom • A bloom is an increase in biomass, not photosynthetic rate • The hypothesis states that a bloom begins when the mixed layer shoals to a depth • above the critical depth horizon where production (P) > respiration (R) • R = grazing + sinking + phytoplankton respiration + all other losses • R is assumed constant • Inverse of Sverdrup: prior to crossing the critical depth criterion, net growth is negligible • or negative * Gran & Braarud. 1935. J. Biol. Board Can. 1 (5), 279-467
Sverdrup: net growth can be independent of gross production • under heavy grazing • Sverdrup: the ‘bloom’ observed 2 days after “the depth of the mixed • layer was for the first time smaller than the critical depth” likely • reflected advection not rapid local growth • Sverdrup: the first increase in biomass occurred before stratification • Sverdrup: “It is therefore not advisable to place too great emphasis on the agreement between theory and [the Weather Ship ‘M’] observations” • (occurrence of blooms in the absence of stratification is not uncommon) * e.g., Townsend et al. 1992. Nature360, 59-62
Abandoning Sverdrup 80 70 60 50 40 30 20 10 0 A 70 70 NA-12 60 60 NA-11 NA-10 NA-9 NA-8 NA-7 50 50 NA-6 NA-4 NA-5 NA-3 NA-2 NA-1 40 40 30 30 0.01 0.1 1.0 10 Chlorophyll (mg m-3) = 1989 NABE = 2008 NAB = focus in later slides • SeaWiFS data 1998 – 2006 • 8-day resolution • 12 central NA bins, minimize advect. • Chlsat = OC4-V4 • Cphyto = GSM / Westberry et al 2008
NA-5 - Latitude range: 45o – 50oN • North Atlantic seasonal cycles are dominated by changes in biomass • Thus, Cphyto ~ Chlsat • Differences between Cphyto and Chlsat consistent with photoacclimation • All analyses have been completed with both C and Chl • Results to follow are the same irrespective of C or Chl • Remaining slides focus on C • within-bin standard deviations shown above
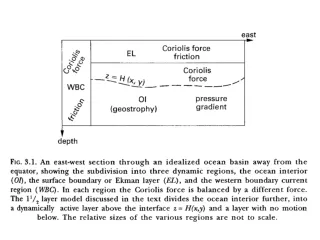
PAR MLD NA-5 - Latitude range: 45o – 50oN • peak biomass occurs in spring • coincident with rising PAR and shoaling MLD • also associated with rapid rise in primary production • Conclusion: phytoplankton in the North Atlantic exhibit a repeated vernal bloom caused by increased primary production and growth associated with rising light and shallowing mixed layers – aka, Sverdrup … unfortunately, biomass can be a terribly misleading thing…. & correlation is not causation
Bloom in a Bottle • To understand what causes a bloom, it is necessary to first identify when a bloom started • The start of a bloom can not be defined by biomass - e.g., when biomass X mg m-3 or Y% above annual median • Using biomass can lead to the wrong start date and association of bloom initiation with the wrong environmental forcing • Bloom initiation implies a change in the rate of growth – for Sverdrup it was the beginning of positive net growth • An easy way to get a first-order sense of rate changes is to plot biomass on a logarithmic scale 5% > mean Net growth rate = r = ln(C1/C0) = slope of log plot t1 – t0
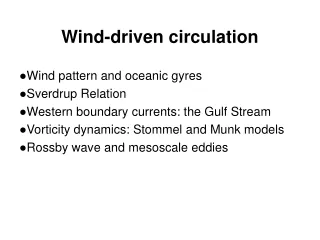
Abandoning Sverdrup • The North Atlantic bloom does not begin in the spring • Net exponential growth begins mid-winter • Shift from negative to positive biomass changes coincides • with the cessation of mixed layer deepening • Net growth rates are, on average, comparable from winter • through spring • Net growth rates do not reflect changes in incident light, • photosynthetic rate, or gross growth rate (µ) • The critical depth hypothesis can be dismissed NA-5 - Latitude range: 45o – 50oN Cphyto
r = ln[(C1× MLD1) /[(C0×MLD0)] t1 – t0 r = ln(C1/C0) t1 – t0 Bloom in a Bottle • Population specific net growth rates (r) can be calculated from changes in phytoplankton concentration (m-3) so long as the mixed layer is either shoaling or not deepening • However, one must consider the influence of dilution when the mixed layer is deepening • A dilution correction should be considered when assessing growth rates during mixed layer deepening
NA-5 - Latitude range: 45o – 50oN Deep Shallow • Population net specific growth rate (r) for the active water column becomes positive in late-autumn / early winter and remains positive through the spring until nutrients are depleted • Growth-phase maxima in r can occur during MLD deepening, MLD maximum, or MLD shoaling • Overall, r is inversely related to PAR and µ • In 100% of available complete annual cycles, r becomes positive before PAR begins to increase
NA-5 - Latitude range: 45o – 50oN Shallow Deep Starting now in July • The ‘vernal’ bloom appears to be an event initiated in late fall • Triggering of the bloom appears to be associated with mixed layer • deepening (not shoaling) • How is this possible? Why the mid-winter decrease in r?
How is this possible? *µ = NPP / CZ NA-5 - Latitude range: 45o – 50oN * • A net specific growth rate of 0.02 implies approximately 1 division per month • Typical winter C = 4 – 8 mg m-3, Typical spring C peak = 25 – 70 mg m-3 • NA bloom requires 2 – 4 doublings over 3 - 4 months, or average r of 0.009 to 0.03 d-1
Positive r through winter is allowed because losses co-vary with µ (Sverdrup assumed this ‘respiration’ to be a constant) – r µ 0 as PAR 0 at very high latitudes in mid-winter (no light) – a critical depth can never be reached • The increase in r during winter implies that the fraction of µ that escapes predation and other losses (i.e., r:µ) must increase in the winter
* Diluted Digression Landry & Hassett 1982 Mar. Biol. 67, 283-288 Landry et al. 1995 Mar. Ecol. Prog. Ser. 120, 53-63 *
* The ‘Grand Dilution Hypothesis’ • As a replacement for the Critical Depth Hypothesis, it is proposed that the north Atlantic bloom is a consequence of a massive scale ‘dilution experiment’ • Mixed layer deepening causes a slight decoupling between phytoplankton growth and losses (grazing, mostly) • The ‘decoupling’ increases so long as the mixed layer continues to deepen • Mixed layer shoaling drives a ‘re-coupling’ of phytoplankton growth and losses (grazing) • Thus, while spring shoaling and increasing light favor enhanced photosynthesis and growth, they also favor heavier grazing losses Landry & Hassett 1982 Mar. Biol. 67, 283-288 Landry et al. 1995 Mar. Ecol. Prog. Ser. 120, 53-63 *
Modeling the ‘Grand Dilution’ • As an initial attempt, a simple model was developed and compared to average annual cycles of the r:µ ratio and r for each of the 12 bins • Model input was the value of r:µ during the first week in July (-0.01) and MLD and Zeu (from Chlsat) • The 3 model conditions were as follows: • Mixed layer deepening within the euphotic zone, entrains phytoplankton and grazers • NO CHANGE in r:µ MLD0 Zeu
Modeling the ‘Grand Dilution’ • As an initial attempt, a simple model was developed and compared to average annual cycles of the r:µ ratio and r for each of the 12 bins • Model input was the value of r:µ during the first week in July (-0.01) and MLD and Zeu (from Chlsat) • The 3 model conditions were as follows: • Mixed layer deepening below euphotic zone, entrains ‘phytoplankton free’ water • Dilutes predators & Prey • r:µCHANGES IN PROPORTION TO DILUTION Zeu MLD0
Modeling the ‘Grand Dilution’ • As an initial attempt, a simple model was developed and compared to average annual cycles of the r:µ ratio and r for each of the 12 bins • Model input was the value of r:µ during the first week in July (-0.01) and MLD and Zeu (from Chlsat) • The 3 model conditions were as follows: • Mixed layer shoaling ‘cuts off’ the lower population of phytoplankton, has no direct effect on phytoplankton concentration, but concentrates mobile grazers • Shoaling concentrates predators but not prey • r:µCHANGES IN PROPORTION TO MLD CHANGE BUT AT A SLOWER RATE THAN DEEPENING EFFECT Zeu MLD0
Final Comments • Temporal coverage of the satellite record provides a unique opportunity to re-evaluate bloom dynamics • The critical depth hypothesis is found wanting (…actually, it fails miserably…) • A Grand Dilution Hypothesis is suggested, but is not the only potential explanation (aggregation, temperature effects, sinking….?) • Dilution Hypothesis accommodates blooms w/o stratification • Climate change effects on North Atlantic (and other) blooms may be very much different for a ‘Critical Depth’ concept of blooms and a ‘Dilution’ concept of blooms • Revisiting bloom experimentation in North Atlantic?
“ ” * * Winter Chlz Lat trends Mixing velocity Feb C max Lat r µ Cphyt vs Csat