Download
1 / 34
340 likes | 499 Vues
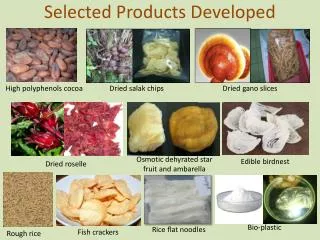
Selected US Agricultural Products, 1910. Selected US Agricultural Crops, 1910. Selected US Agricultural Crops, 1952. US Selected Agricultural Output, 1954. US Selected Agricultural Crops, 1992. US Per Capita Food Production In Pounds. US Coffee Consumption, cups per day.

E N D
Selected US Agricultural Products, 1910 Selected US Agricultural Crops, 1910
Selected US Agricultural Crops, 1952 US Selected Agricultural Output, 1954
US Per Capita Food Production In Pounds
US Coffee Consumption,cups per day • Year Regular Soluble Decaf Gourmet • 1962 2.45 .67 .10 • 1972 1.67 .68 .17 • 1982 1.33 .56 .38 • 1992 1.46 .27 .32 • 2002 1.21 .11 .19 .33
Major US Fast Food Restaurant Chains Sales, 2005 • Chain Sales b$ Units • MacDonald’s 25.6 13,700 • Burger King 7.9 7,400 • Wendy’s 7.7 6,000 • Subway 7.2 19,620 • Taco Bell 6.1 5,100 • Pizza Hut 5.3 6,300 • Starbuck’s 5.3 7,300 • KFC 5.2 5,400
Full Service Restaurant Chain Sales, 2003 • Chain Sales b$ Units • Applebee’s 3.6 1,585 • Chili’s 2.6 2,726 • T.G.I. Friday’s 2.5 3,374 • Red Lobster 2.4 3,578 • Outback 2.4 3,320 • Denny’s 2.2 1,361
China Foodstuffs Production (1990 = 100)