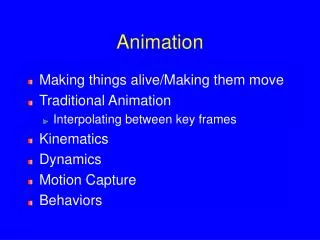
Animation
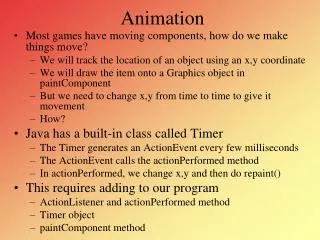
Animation. CSC 161: The Art of Programming Prof. Henry Kautz 10/ 14/ 2009. Status. Programming assignment 6: Graphics Part I: Due 10:00am, Sat 24 October Part II: Due 10:00am, Sat 31 October To be completed in teams of two assigned by Lab TA

Animation
E N D
Presentation Transcript
Animation CSC 161: The Art of Programming Prof. Henry Kautz 10/14/2009
Status • Programming assignment 6: Graphics • Part I: Due 10:00am, Sat 24 October • Part II: Due 10:00am, Sat 31 October • To be completed in teams of two assigned by Lab TA • Next workshop: telling a story through animation • Homework: Read Zelle Chapter 5 • Monday: bring at least one written question about something in the chapter that was mysterious or puzzling! • Monday: Final graphics, plus introduction to functions (Ch 6.1 - 6.3) • Wednesday: In-class midterm exam on everything to date. Bring: • Pencils • Calculator • 1 page of notes / crib sheet
Problems using Graphics Library? • See detailed instructions for both PC and Macintosh – follow Programming Help link on Blackboard course home page • Solution to "module not found" problem • Solution to "console window" problem
Where We Were from graphics import * def main(): w = GraphWin('Test', 300, 300) for i in range(5): p = w.getMouse() label = Text(p, 'Ouch!') label.draw(w) main()
GraphWin Objects • Graphwin(title, width, height) • Constructor: creates and returns a window object • w = GraphWin('hello', 300, 600) • close() • getMouse() • Wait for click, return Point object • p = w.getMouse() • checkMouse() • Like getMouse, but don't wait: if user does not click, then return None
Graphical Objects • Point, Line, Circle, Oval, Rectangle, Polygon, Text • All support • setFill( <color> ) • setWidth( <number of pixels> ) • draw( <GraphWin> ) • undraw( <GraphWin> ) • move( dx, dy ) • clone() • Return a copy of the object • Compare: x = y versus x = y.clone()
Points • Point(x, y) • Constructor • getX() • getY() • Example: p = Point(99, 21) if (p.getX() == 99): print "yes" p.move(10,10) if (p.getX() == 99): print "no"
Lines • Line(point1, point2) • getP1() • getP2() • Line from (10, 20) to (30, 40) is: • L = Line(Point(10,20), Point(30,40))
2-Dimensional Shapes • Circle( centerPoint, radius ) • getCenter() • getRadius() • Rectangle( point1, point2 ) • Points at opposite corners of the rectangle • getP1() • getP2() • Polygon( point1, point2, point3, ... ) • Arbitrary polygon
Text Objects • Text( anchorpoint, string) • Anchor is center of text • setText( string ) • Change the text • setSize( number ) • 5 to 36 • setTextColor( string )
Uses of Graphics • Displaying data • See example in textbook: creating a bar chart of the amount of an investment • Games!
Duck Shoot • Goal: shoot a moving target 5 times • Once the target it hit, it changes color from yellow to red • You can shoot the target at most once until it reverses direction
from graphics import * def main(): w = GraphWin("duckhunt", 400,200) # THE PROGRAM w.getMouse() w.close() main()
w = GraphWin("duckhunt", 400,200) c = Circle(Point(100,100),20) c.setFill('yellow') c.draw(w) d = 1 # direction -1 = left, 1 = right p = 0 # number of hits alive = True # is duck alive right now?
while p<5: m = w.checkMouse() if m != None and alive: x = m.getX() y = m.getY() xc = c.getCenter().getX() yc = c.getCenter().getY() if ((x-xc)**2 + (y-yc)**2) < 400: c.setFill('red') p = p + 1 alive = False
elifc.getCenter().getX() >= 380: d = -1 c.setFill('yellow') alive = True elifc.getCenter().getX() <= 20: d = 1 c.setFill('yellow') alive = True c.move(d*4,0)
while p<5: m = w.checkMouse() if m != None and alive: x = m.getX() y = m.getY() xc = c.getCenter().getX() yc = c.getCenter().getY() if ((x-xc)**2 + (y-yc)**2) < 400: c.setFill('red') p = p + 1 alive = False elifc.getCenter().getX() >= 380: d = -1 c.setFill('yellow') alive = True elifc.getCenter().getX() <= 20: d = 1 c.setFill('yellow') alive = True c.move(d*4,0)
from graphics import * def main(): w = GraphWin("duckhunt", 400,200) c = Circle(Point(100,100),20) c.setFill('yellow') c.draw(w) d = 1 p = 0 alive = True while p<5: m = w.checkMouse() if m != None and alive: x = m.getX() y = m.getY() xc = c.getCenter().getX() yc = c.getCenter().getY() if ((x-xc)**2 + (y-yc)**2) < 400: c.setFill('red') p = p + 1 alive = False elifc.getCenter().getX() >= 380: d = -1 c.setFill('yellow') alive = True elifc.getCenter().getX() <= 20: d = 1 c.setFill('yellow') alive = True c.move(d*4,0)