Download
1 / 1
10 likes | 160 Vues
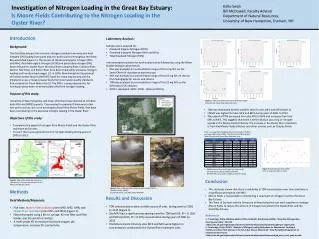
Investigation of Nitrogen Loading in the Great Bay Estuary: Is Moore Fields Contributing to the Nitrogen Loading in the Oyster River ?. Katie Swan Bill McDowell, Faculty Advisor Department of Natural Resources, University of New Hampshire, Durham, NH. Laboratory Analysis:

E N D
Investigation of Nitrogen Loading in the Great Bay Estuary: Is Moore Fields Contributing to the Nitrogen Loading in the Oyster River? Katie Swan Bill McDowell, Faculty Advisor Department of Natural Resources, University of New Hampshire, Durham, NH • Laboratory Analysis: • Samples were analyzed for: • Dissolved Organic Nitrogen (DON) • Dissolved Inorganic Nitrogen (NH4 and NO3) • Total Dissolved Nitrogen (TDN) • Instrumentation analyses for each analysis were followed by using the Water Quality Analysis Lab protocols. • NH4 was analyzed at a concentration range of 0 to 5 mg N/L on the SmartChem for absorbance spectroscopy. • NO3 was analyzed at a concentration range of 0 to 15 mg N/L on the Ion Chromatography for anions and cations. • TDN was analyzed at a concentration range of 0 to 22 mg N/L on the Schimadzu TOC analyzer. • DON is calculated. DON= (TDN – (NH4 and NO3)). • Introduction • Background: • The Great Bay estuary has a chronic nitrogen problem from excessivetotal nitrogen (TN) loading from point and non-point sources throughout the Great Bay watershed (Figure 1). TN consists of dissolved inorganic nitrogen (NO3and NH4), dissolved organic nitrogen (DON) and particulate nitrogen (PN). Seven tributaries: Oyster River, Winnicut River, Lamprey River, Cocheco River, Salmon Falls River, and Exeter River have been impaired by excessive nitrogen loading and low dissolved oxygen (1). In 2009, New Hampshire Department of Environmental Services (NH DES) listed the Great Bay estuary and the tributaries as an a impaired water body from poor water quality standards that violated the Clean Water Act (2). The EPA is issuing new permits for municipal waste water treatment plants that limit nitrogen loading. • Purpose of this study: • University of New Hampshire and Town of Durham have planned to combine both MS4 and NPDES permits. They wanted to examine if there were other non-point sources such as an active agricultural field, Moore Fields, that have been contributing to the excessive nitrogen loading in the Oyster River. • Objectives of this study: • To examine the export of nitrogen from Moore Fields and the Oyster River mainstem at five sites. • To see if there was a general trend of nitrogen loading during years of 2001 to 2013. • TDN was dominated by NO3 and NH4 seen for sites MF2 and MF4 (Table 1). • FWMC was highest for Sites MF2 and MF4 during years of 2001 to 2013. • The export of TDN decreased from site MF2 to MF4 and increased from site MF1 to MF3. This suggests that there is either dilution occurring or nitrogen uptake in the Moore Fields tributary. The increase in the Oyster River mainstem is from the Moore Fields tributary and other sources such as Chesley Brook. Figure 3. TDN concentration over time for Moore Fields Tributary and Oyster River Mainstem sites. Table 1. Average Flow Weighted Mean Concentration (FWMC) and Export (kg/yr/ha) of NO3, TDN, NH4, and DON for Moore Fields Tributary and Oyster River Mainstem sites. Figure 5. Discharge (cfs) from Oyster River during years 2001 to 2013. • FWMC concentration and Export rate used runoff during years of 2001 to 2008 for Site MF0.. • Site MF1-MF4, used years of 2001 to 2013 for runoff. • Conclusion • This study has shown that there is variability in TDN concentration over time and there is a significant decrease at site MF2. • Moore Fields is responsible in contributing a small part of nitrogen runoff to the Great Bay Estuary. • The Town of Durham and the University of New Hampshire can work together to manage Moore Fields to reduce the amount of nitrogen can protect the Oyster River and the Great Bay Estuary. Figure 1. Map of the Great Bay watershed and estuary in Coastal New Hampshire and Maine (Trowbridge, 2010) Figure 2. Map of Moore Fields study site with sites MF0-MF4 (Michelle Daley, WRRC). Counterclockwise: Sites MF1, MF2, MF3,MF4 • Methods • Field Methods/Materials: • Five sites: Moore Fields tributary(sites MF0, MF2, MF4) and Oyster River mainstem(sites MF1 and MF3) (Figure 2). • Filtered samples using a 60 mL syringe, 45 mm filter and filter holder, and 30 and 60 mL bottles. • A multi-probe YSI to measure dissolved oxygen, pH, temperature, and specific conductivity. • Results and Discussion • TDN concentrations were variable across all sites during years of 2001 to 2013 (Figure 3). • Site MF2 had a significant decreasing trend for TDN (p<0.05, R2 = 0.116) and NO3 (p<0.05, R2 = 0.170) concentration during years of 2001 to 2013. • The Moore Fields tributary sites MF2 and MF4 were highest in concentration compared to the Oyster River mainstem sites. References 1. Trowbridge, Philip, Matthew Wood, Jeffrey Underhill, David Healy. (2009). "Great Bay Nitrogen Non-Point Source Study": NH DES. <http://des.nh.gov/organization/divisions/water/wmb/coastal/documents/gbnnpss-report.pdf>. 2. Trowbridge, Philip. (2010). "Analysis of Nitrogen Loading Reductions for Wastewater Treatment Facilities and Non-Point Sources in the Great Bay Estuary Watershed." New Hampshire Department of Environmental Services. <http://des.nh.gov/organization/divisions/water/wmb/coastal/documents/gb_nitro_load_analysis.pdf>.