IPCC AR5 WG1 Chapter 1: Introduction
330 likes | 577 Vues
IPCC AR5 WG1 Chapter 1: Introduction. Olivia Clifton Seminar on IPCC AR5 WG1 Columbia University 01/31/2014. Goals of Chapter 1 of IPCC AR5 WG1 . Focus on the concepts & definitions applied in the discussions of new findings

IPCC AR5 WG1 Chapter 1: Introduction
E N D
Presentation Transcript
IPCC AR5 WG1 Chapter 1: Introduction Olivia Clifton Seminar on IPCC AR5 WG1 Columbia University 01/31/2014
Goals of Chapter 1 of IPCC AR5 WG1 • Focus on the concepts & definitions applied in the discussions of new findings • Examine several key indicators for a changing climate & show how current knowledge of those indicators compares w/ projections in previous assessments • Introduce new human-related emissions scenarios • Address directions & capabilities of current climate science
Key concepts of climate science • Weather vs. climate • Climate change • A change in the state of the climate • can be identified by changes in the mean &/or variability of the properties about the mean • e.g. using statistical tests • persists for an extended period • typically decades or longer
Main drivers of climate change Dominant energy loss of LWR (aka Infrared radiation)
Radiative Forcing (RF) • Measure of net change in energy balance in response to an external perturbation • External perturbation can be caused by changes in atmosphere, ocean, biosphere and cryosphere • New concept to AR5: Effective RF (ERF) • Accounts for rapid response in the climate system • Definition: change in net downward flux at TOA after allowing atmospheric temperature, water vapor, clouds and land albedo to adjust • either SSTs and sea ice cover unchanged or global mean surface temperature unchanged
Feedbacks • Mechanisms exist in the climate system that either amplify (+ feedback) or diminish (- feedback) effects of a change in climate forcing (Le Treut et al., 2007) • Critical: Timescales can be hours or decades & centuries • Example of a + feedback: atmospheric water vapor increase in surface temp --> increase in atmospheric H20 (a powerful GHG) --> increase in GHG effect --> increase in surface temperature
Climate feedbacks & timescales +/- refers to mechanism and how it feeds back on rising temperature and rising CO2 Large range of timescales for different feedbacks!
Transient vs. Equilibrium Model Simulations • Equilibrium • Allow climate model to adjust fully to a specified change in Radiative Forcing • Convey difference between initial and final states of model-simulated climate • Transient • Apply changes in Radiative Forcing gradually over time • More realistic
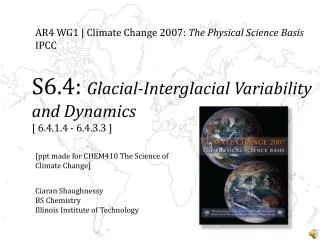
“Climate change commitment is defined as the future change to which the climate system is committed by virtue of past or current forcings.” • Components of climate system respond on a large range of timescales • If anthropogenic emissions immediately ceased or climate forcings immediately became fixed, climate system would continue to change until equilibrium • Paleoclimate data can help us to understand slow equilibrium processes
Natural Variability • Observe periodic and chaotic variations on a large range of spatial and temporal scales • even in the absence of external forcing • Simple distributions (e.g. unimodal or power law) sometimes represents this variability • However, many components of the climate system also exhibit multiple states • glacial-interglacial cycles, ENSO • Movement b/w states can occur due to natural variability or external forcing • Relationship b/w variability, forcing, and response reveals complexity of dynamics of climate system • Hysteresis: concept of irreversibility in the climate systems • Trends in observations during short-timescale periods (decades) can be dominated by natural variability in Earth’s climate system (Hawkins and Sutton, 2009) • Climate model experiments • In most of model simulations, an “episode” does not necessarily occur as a duplicate of & with same timing as the observed “episode”
Multiple lines of evidence • Careful analysis of observational records of the atmosphere, land, ocean & cryosphere • in situ, ice core, instrumental observations, satellites • Conceptual and numerical models of Earth’s climate system • Detection & Attribution: assessing changes occurring in climate with statistical tools to test model vs. obs. • Historical sources, natural archives, proxies for key climate variables • Quantitative with respect to past regional-to-global climate and atmospheric composition variability • Reconstructions tell us about responses of climate system to external forcings and internal variability on different timescales AR5: new info on external forcings caused by variations in volcanic and solar activity; reconstructed paleoclimate temps and attributions to past variations in external forcings
How well do the projections used in the past assessments compare with obs. to date? Chapter & section in AR5 that assesses this indicator of change Color Key to Indicators of change: Temperature, hydrological, others
How well do the projections used in the past assessments compare with obs. to date? Color Key to Indicators of change: Temperature, hydrological, others
Estimated changes in the observed globally & annually avgsfc temp anomaly relative to 1961-1990 compared with the range of projections from previous IPCC assessments Range of results at 2035 for each scenario Anomalies calculated from 1961-1990 mean AR4: Add’l measure of natural variability; earlier projections based on models of intermediate complexity; previous assessments have lacked some or all aerosols and natural variability
Greenhouse Gas Concentrations Observed globally & annually averaged CO2 concentrations in ppm since 1950 compared with projections from previous IPCC assessments Range of results at 2035 for each scenario
Greenhouse Gas Concentrations Observed globally & annually averaged CH4 concentrations in ppb since 1950 compared with projections from previous IPCC assessments Range of results at 2035 for each scenario Methane stabilizes 1999-2006, then increases again in 2007; SRES scenarios developed in 2000 don’t capture this trend
Greenhouse Gas Concentrations Observed globally & annually averaged N2O concentrations in ppb since 1950 compared with projections from previous IPCC assessments Range of results at 2035 for each scenario Observed trends of nitrous oxide tend to be in lower part of projections for previous assessments
Extreme Events • A definition: rare or rarer than the 10th or 90th percentile of a probability density function estimated from the observations; rare at a particular place and/or time of the year • At present, single extreme events cannot generally be directly attributed to anthropogenic influence • In some circumstances, the change in likelihood for the event to occur was attributable to accounting for observed changes in climate • For some climate extremes, such as drought, floods and heat waves, several factors, such as duration and intensity, need to be combined to produce an extreme event (Seneviatne et al., 2012)
(Gaussian) PDFs of daily temperature (~ Gaussian) and daily precipitation (~ skewed) - - - previous distribution ----- changed distribution (Skewed) In a skewed distribution, a change in the mean of the distribution generally affects its variability or spread. An increase in precipitation would thus lead to an increase in heavy precipitation extremes and vice versa. Furthermore, climate change may alter the frequency of precipitation and the duration of dry spells between precipitation events.
“Extremes” Table shows change in confidence level for extreme events based on prior IPCC assessments Green = extreme event discussed in all 3 reports
Climate Change Indicators • Sea Level (ocean warming & land ice melt) • Direct observations: tide gauges (150 yrs) and satellite radar altimeters (20 yrs) • AR4 and SREX say global climate change is likely cause of sea level rise even with regional variability from non-uniform density change, circulation changes, & deformation of ocean basins • Long-term sea level rise has decadal & multi-decadal oscillation, but 20th century sea level still > 19th century • Ocean Acidification (ocean uptake of CO2) • Observed decrease in ocean pH resulting from increasing CO2 has significant impact on chemistry of sea water • Due to the increased storage of carbon by the ocean, ocean acidification will increase in future -> potentially serious threats to health of world’s ocean ecosystems • Ice (amount of ice on land & ocean) • Summer 2012 lowest Northern Hemisphere sea ice extent on record • AR4 finds no consistent trends for Antarctica sea ice, but more recent studies indicate a small increase • Since AR4, improvements in techniques of measurements and understanding of the change
Estimated changes in observed global annual mean seal level since 1950 relative to 1961-1990 Range of results at 2035 for each scenario Earlier models had greater uncertainties in modeling the contributions due to limited observational evidence and deficiencies in theoretical understanding of relevant processes. Also earlier assessments don’t include unforced or natural interannual variability.
Uncertainty • Scenario uncertainty due to uncertainty of future emissions of GHGs and other forcing agents • “Model uncertainty” associated with climate models • Ambiguous term, IPCC AR5 sets definitions • Model spread: range of behaviors observed in ensembles of climate model • Model uncertainty: describes uncertainty about the extent to which any particular climate model provides an accurate representation of the real climate system; arises from approximations required in the development of models • Internal variability and initial condition uncertainty • AR5: square brackets show 90% uncertainty interval • interval likely to have 90% likelihood of covering the value that is being estimated • Boundary condition uncertainty for the assessment of historical and paleoclimate simulations
Treatment of Uncertainty in IPCC AR5 5 Confidence Levels A combination of different methods, such as observations and modeling, is important for evaluating confidence level. Qualifier “likelihood” expresses a probabilistic estimate of the occurrence of a single event or of an outcome
Development of capabilities of observations # of satellite instruments assimilated into the European Centre Medium-Range Weather Forecasts; demonstrates five-fold increase in usage of satellite data over this time
Capabilities in Global Climate Modeling; Development of climate models over the last 35 years Continuing increase in horizontal and vertical resolution; especially evident in refined ocean grids below Size of cylinder represents complexity and range of processes of each aspect --> Representation of Earth System processes are much more expensive and improved, particularly for the radiation and the aerosol cloud interactions and for the treatment of the cryosphere
Historical and projected total anthropogenic RF (W/m2) relative to ~ 1765 (preindustrial) between 1950 and 2100 AR5, designed for CMIP5 Previous IPCC Since AR4, the incorporation of ‘long-term’ paleoclimate simulations in the CMIP5 framework has allowed incorporation of information from paleoclimate data to inform projections.
Description of Future ScenariosTotal RF (anthro+natural; W/m2) for RCPs and ECPs
Description of Future Scenarios GHG Concentrations for RCPs and ECPs
Description of Future ScenariosEquivalent a) CO2 concentration and b) CO2 emissions (no land use) for RCPs and ECPS and some SRES
Description of Future Scenarios Anthropogenic BC emissions Anthropogenic NOx emissions Anthropogenic SOx emissions
If understanding of the climate system has increased, why hasn’t the range of temperature projections been reduced?