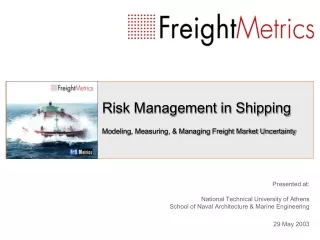
Developments in Freight Derivatives and Shipping Risk Management
370 likes | 1.13k Vues
Nikos Nomikos Cass Business School. Developments in Freight Derivatives and Shipping Risk Management. Current Developments in Shipping Markets. Freight as a new commodity High volatility in the shipping markets Sharp fluctuations and sudden changes in the market

Developments in Freight Derivatives and Shipping Risk Management
E N D
Presentation Transcript
Nikos Nomikos Cass Business School Developments in Freight Derivatives and Shipping Risk Management
Current Developments in Shipping Markets • Freight as a new commodity • High volatility in the shipping markets • Sharp fluctuations and sudden changes in the market • Emergence and growth of a paper market on Shipping Freight • More extensive use of risk management techniques and instruments • Entrance of new players in the shipping markets • trading houses and energy companies as well as investment banks and hedge funds
Fundamentals of the Bulk Shipping Markets • Freight rates reflect the cost of transporting bulk commodities by sea across different parts of the world • Market Segmentation • Across Type of Commodity • Wet Market: Transportation of Crude Oil and Oil products • Dry Market: Dry Bulk Commodities – Grains and agricultural, Coal, Iron Ore etc. • Across Sizes • Commodities are transported in different sizes according to their Parcel Size Distribution Function
Freight Rate Formation in the Physical Market Spot freight rates are determined through the interaction of supply and demand for shipping services at any point in time • The demand for sea transportation is a derived demand, which depends on world economic activity and international trade • The world economic activity • Seaborne commodity trade • Average haul Demand • Political events • Transportation cost • The supply of shipping services is the amount (ton-miles) of transportation service offered by shipowners’ fleet based on the optimisation of their revenue • Stock of the fleet • Shipbuilding production • Scrapping and losses Supply • Fleet productivity • Freight rates
FR demand new demand supply ton-miles Freight Rate Formation Spot freight rate determination through interaction between supply and demand curves for shipping services
Risk management options in shipping Option A: Do nothing & fix spot High risk / Unpredictable Option B: Timecharter, COA or long term management Inflexible / inefficient pricing Option C: Hedge with FFA and use profit / loss to pay for spot physical deal Opportunities to cover requirements, quickly fixed and flexible to allow you to alter your position should it change
Forward Freight Agreements (FFAs) “An agreement made between a buyer and seller to settle the difference between a freight rate agreed today and the future price of the freight rate on a specific voyage” • Cash settled • Standardised contracts and lot sizes – opportunity to close out positions quickly & easily • Suitable for hedgers– ability to take significant cover quickly and simply • Flexible periods • Tradable on different routes and vessels • Over The Counter and Cleared markets • Cleared market is “OTC Cleared” i.e. not exchange listed • Anonymous, rapid and cost effective execution
Forward Freight Agreements – Underlying Routes • Dry Market • Baltic Capesize Index (BCI) (150,000+ dwt) • Baltic Panamax Index (BPI) (70,000+ dwt) • Baltic Supramax Index (BSI) (52,000+dwt) • Wet Market • Baltic Tanker Index (Dirty and Clean) • Baltic LPG Index (44,000cbm) • Platts Assessments • Arithmetic average taken of worldwide shipping panel & published at 1300pm GMT
Baltic Capesize Index (BCI) • Routes 8 to 11 are based on a standard 172,000 mt dwt “Baltic Capesize” vessel with certain clearly defined performance measures • FFAs can be traded against any of these individual routes or against the averages of Routes 8 to 11 • Most trades concentrate on C4, C7 and the average of C8-C11
Baltic Dirty Tanker Index (BDTI) • Most trades concentrate on TD3, TD4, TD5, TD7 and TD8
FFA Trading in the OTC market - Practicalities Broker establishes trading interest and obtains a firm ‘Bid’ and ‘Offer’ Full trade confirmation agreed verbally with both counterparts. Recap of trade issued detailing main terms. Full contract issued for signing. Original kept by broker On settlement day, the settlement price is calculated and a settlement statement is issued. Settlement funds paid no later than 5 London banking days after each settlement date
FFA Trading in the OTC Market - Practicalities • OTC FFAs are traded through a network of specialist FFA brokers. The brokers are members of the Forward Freight Agreement Brokers Association (FFABA) • Contract used is either FFABA or ISDA® contract • Counterparties can be anonymous until just before trade terms are concluded • Hedges can be offset prior to expiry • Settlement is between the counterparties in cash within five days following the settlement date. • The broker, acting as an intermediary only, is not responsible for the performance of the contract. Typically, brokers get commission of 0.25% from each party on the fixed (or expected) freight rate but that may differ between contracts
Number of lots traded in FFA market 1600000 wet 1400000 dry 1200000 1000000 800000 600000 400000 200000 0 1994 1995 1996 1997 1998 1999 2000 2001 2002 2003 2004 2005 2006e FFA Volume in the OTC Market Notional Market Value (dry) 05 Cape: $8bn Pmx: $15bn Supra: $5bn Coal: 500m tons Wet: $8bn Source: FIS
Uses of FFAs • Hedging • Cargo owners (power utilities, oil companies) are buyers of FFAs • Market information • Forward curves • Speculation • FFAs give the possibility to profit from falling freight markets • Enhanced trading opportunities • Arbitrage trades (e.g. API2 vs API4) • Spread trades (TD3 vs TD5, Cape vs Panamax) • Collateral in ship finance transactions
Uses of FFAs: Tanker Hedging • It is early April 2001, and TD7 (80,000mt North Sea to Continent) is trading at WS 125 for June. • An energy trading company is worried that freight rates will increase over the following 12 weeks, and decides to use FFAs to cover this risk. The company thus buys 80 TD7 June 2001 contracts @ WS 125 (each contract being for 1,000 tons) • At the end of June, the settlement price is WS 156.15 (calculated as the average of TD7 freight rate assessments over June) • The charterer will incur higher freight rates in the physical market, but, at the same time, he has made a profit in the FFA market: • Net WS = 156.15 – 125 = WS31.15 • Settlement = Contracts x Lot Sizex Flat Rate x net WS = 80 x 1,000mt x $4.30/mt x 31.15% = $107,156
Uses of FFAs: Forward Curves • Forward curve is a ’snapshot’ of current market forward price expectations. • An implied market forecast – based on all market participants • A method of comparing FFA opportunities against physical options. • Used for position and portfolio valuations. • In all, a key tool for freight market users
Forward curves: Dry Source: FIS
Forward curves: Tankers Source: IMAREX
Forward Curves: RBay – Rdam Coal Route Source: Baltic Exchange
Uses of FFAs: Trading Opportunities • Good liquidity in FFAs – position tradability- ‘buy’ and ‘sell’ • High volatility – position taking opportunities • Easier to trade than physical • More trading players than physical • Investment banks, trading houses, hedge funds • Physical Asset Swaps – Diversification • Spread Trades • Inter route spread, e.g. C4 v C7, TD3 v TD5 • Inter month spread, e.g. 3rd Q06 v 4th Q06 • Inter-size spread, e.g. P-4TC v C-4TC
FFAs: What are the risks? • Credit Risk (Netting Clause) • Volatility of market • Limited forward period • Usually up to 2-4 years • Hedging and speculation are different approaches • Basis risk • Liquidity risk • Overall, less risky than physical market
Credit Risk in the Freight Derivatives Market • Credit risk is particularly relevant for the shipping derivatives market since most of the paper trades are done on a principal to principal basis • Trading cleared contracts • IMAREX with NOS in Oslo offer cleared FFAs and Options • London Clearing House, NYMEX and Singapore Exchange also provide clearing services • Cleared FFAs provide protection against counterparty default, however • Margin requirement and initial deposits tie-up a lot of capital • Margining and marking to market may create a cash-flow mismatch between the paper and physical markets
FFAs – Future Trends • The market has grown sharply following deregulation and liberalisation in the European Energy market as energy and other traders seek to manage freight risk • Recent high volatility in the market has also attracted interest from investors outside shipping such as hedge funds • Credit Risk and Clearing • Clearing will also attract new players in the markets as it also facilitates and speeds up negotiations • Electronic Trading • Emergence of Freight Options • Asian Options on Freight Rate • Create opportunities for asset owners • Pricing and risk management issues
Conclusions • Freight as a new commodity • High volatility in the shipping markets • Growth of a paper market on Shipping Freight • More extensive use of risk management techniques and instruments • Concerns regarding credit risk • Entrance of new players in the shipping markets • trading houses and energy companies as well as investment banks and hedge funds