Download

1 / 31
310 likes | 466 Vues
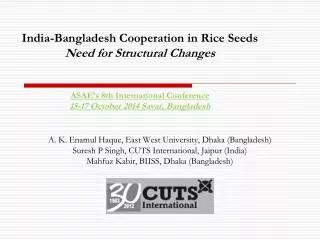
“Moving Out of Low Poverty Trap: Investing at the Bottom of the Pyramid” A. Q. M. Golam Mawla General Manager, PKSF. Dhaka, Bangladesh 29 October 2014. 1. 15 % above PL. 26 % below PL. Bottom 12.4%. Extreme Poverty (EP) in Bangladesh. food-energy intake: <1,805 Kcal per day

E N D
“Moving Out of Low Poverty Trap: Investing at the Bottom of the Pyramid”A. Q. M. Golam MawlaGeneral Manager, PKSF Dhaka, Bangladesh 29 October 2014 1
15 % above PL 26 % below PL Bottom 12.4% Extreme Poverty (EP) in Bangladesh • food-energy intake: <1,805 Kcal per day • per capita income: < TK. 1103 per month • Around 17.5 million extreme poor Schematic representation of different population segments for inclusive financing Near poor Mainstream microfinance (540) Poverty line 26% Very poor program (12.4%)
EP communities (in million) • Insufficient economic opportunities • Poor access to public services & transfer • Vulnerable to external shocks • Face health and nutrition vulnerability • Gender inequity and marginalised group specific risks & vulnerabilities are also prominent • Extreme poverty is often chronic – it passes down from one generation to the next. • Dalit, & socially excluded communities (5.5) • Tribal/ethnic communities (1.2) • Tea garden labourers (0.1- 0.3) • Beggars (0.7) • Domestic help (0.42) • Physically handicapped population (10.6%, WHO) • Street children (tokai) • Economically insolvent elderly people (appx 7% of total population) • Extreme poor living in ‘haors’ (5.5) • Extreme poor living in climate change vulnerable areas/Chars 3
Occupational Distribution of extreme poor • Salient characteristics • Not homogeneous • Vulnerable, limited access to basic needs • Mostly unskilled • Highly dependent on day labor/wages (low-paid wage labor) • Often excluded from the society Occupational Distribution of 1 million participants of PKSF’s UPP programme
Need to Address the Multidimensional Aspects of Poverty • “A condition characterized by severe deprivation of basic human needs, including food, safe drinking water, sanitation facilities, health, shelter, education and information. It depends not only on income but also on access to services.” – UN, 1995 • Multidimensional Poverty Index (MPI) of UNDPmeasures not only income, but also basic needs and living standard • In Bangladesh, 58% population are MPI poor • Dimensions + Indicators • Income + Food poverty line • Health + Daily protein intake • + Source of water for drinking, cooking, and daily work, etc.) • Education + Years of schooling • + School attendance • Living Standard + Type of toilet + Living space • + Electricity, etc. • Access to safety net • + Cash/food for work • + Elderly benefits/ allowances, etc
Income poverty improved but nutritional status still remain alarming! • 41% of children under age 5 are stunted, • 16% are wasted, and • 36% are underweight • 24% of women have BMI <18.5
Key drivers for EP eradication in Bangladesh • Remittance inflow – Nearly 8 million migrant workers contributing $12.5 billion/year • Microfinance – As of 2011 , 34.36 million HHs availing US$ 5.83 billion as microcredit • Ready Made Garments (RMG) – Employ over 4.5 million worker mostly women and contribute 10.5% of GDP • Many fold increase in Agricultural production – Employ nearly 23 million people (nearly 48% of the employment) • Expansion of Social Safety Net Programme – Covering 9.04 million man month at a cost US$ 3.25 billion • Human capacity development – Education, Vocational & Skill Training, Woman empowerment
Related Issues • MDGs Achievements • Reducing poverty • Child mortality reduction (own UN award) • Attaining gender equality • Maternal Health improvement • Universal primary education • Post-2015 Sustainable Development Goals (SDGs) • Bangladesh resets its goal of ending extreme poverty by 2022 • Targets to be middle income country (MIC) – reaching threshold per capita income of $1,130 – by 2021 8
Productivity • Productivity is an average measure of the efficiency of production - i.e. output per unit of input. The production performance can be measured as an average or an absolute income. • Productivity is a crucial factor in production performance of firms/ economic activities. Increased productivity helps raising living standards because more real income improves people's ability to purchase (i.e. higher purchasing power). Productivity growth also helps businesses to be more profitable. 9
Strategies for Removing the Trap • Expanding Opportunities (i.e. promoting sustainable livelihoods) • Facilitating Empowerment (enhancing access to services) • Ensuring Protection (both covariant and idiosyncratic - need to be addressed) 11
Promoting Sustainable Livelihoods • A livelihood is sustainable when it can cope with and recover from stresses and shocks, maintain or enhance its capabilities or assets, while not undermining the natural resource base • Livelihood strategies Reduced reliance on day-labour Creating ‘livelihood ladders’ Enhanced regular income from market-based IGAs • Livelihood outcome • More income & increased well-being • Reduced vulnerability & improved food security • More sustainable use of NR base • Key questions: What will be transforming structures and process? What will be role of government/private sector/MFIs? 12
Removing constraints of the bottom poor – Demand Side Issues • Technical know-how and demand-driven technical services • Appropriate financial services • Market linkage - quality assurance, knowledge on market demand • Potential areas of investment • Farming(Livestock) • Goat (Black Bengal, Boer, Jamnapari) or sheep (Chotanagpur, Dmarah, Suffolk) farming : Buck center, Small breeding unit, • Dairying (Fresian cross - at least 8 litter average milk) • Beef (Crossbred bull calves, Pabna/shahiwal) • Land leased based farming specially in char area • High value commercial vegetable gardening • Off-farming- Small business, vocational trades, tailoring 13
Homestead Gardening Traditional gardens are scattered, seasonal • Net profit • BDT 530-650/- decimal year. • Provide vegetable 42.89 gm/person/day. • Investment • Total investment BDT 60-80/- per decimal/year.) • Traditional vegetable garden Developed gardens produce vegetables throughout the year, produce more varieties of vegetables and are on fixed plot of land (bed system-Robi, Kharif-1, Kharif-2). • Net profit • BDT 2,350-2,600/-/dec/year. • Provide vegetable 364.56 gm/person/day. • Investment • Total investment BDT 180-200/- per decimal/year.) • Developed vegetable garden
Small Scale nursery • Investment/1decimal • Total investment (seed, tree/fruit sapling, fertilizer etc.) BDT 25,400/- per decimal/year.) • Income • Income BDT 53,600/- per decimal land/year.
Native Shing/Magur, Tengra, Koi fish culture • Magure/Shing culture/2decimal pond • Investment • Total investment BDT 13,800/- per decimal pond/year (2 crops/year.) • Net profit • BDT 18,200./- per decimal/year (2 harvest/year) • Thai koi culture/2 decimal pond • Investment • Total investment BDT 5,500/- per decimal pond/year (2 crops/year.) • Net profit • BDT 8,500/- per decimal/year (2 crops/year)
Fish Culture (Crab fattening) Traditional method crab fattening- encircle earthen area (Pond/Gher)- • Investment • Total investment BDT 45,800/- per decimal pond (20 crops/year.) • Net profit • BDT 11,000/- per decimal pond (20 crops/year) Scientific method crab fattening -bamboo made floating case- • Investment • Total investment BDT 2,64,770/- from 30 cage (40m2 area) within 12 crops (12 days/crop) • Net profit • BDT 91,630/- from 30 cage (40m2 area) within 12 crops (12 days/crop)
Black Bengal Goat (BBG) rearing LIFT Intervention at WAVE • Total HH (BBG rearer): 6382 • Total goat: 44895 Traditional Non descriptive housing flock size: 1-2 doe No attention to health Small litter size (less than 2) High mortality Investment (yearly) Goat & treatment: 8000/--10000/-Income:Kid: 3500/-5500/- Net profit:2500/-3500/-(2 cycle) Asset:Doe-5000/--6000/- Improved Maccha rearing flock size: 4 doe Regular vaccination & deworming Good litter size (2 or more than 2) Low mortality Investment (yearly) Housing, Goat, feed & treatment: 25000/--30000/- Income:Kid & doe- 42,000/--45000/- Net profit:15000/--18000/- (2 cycle/year) Asset:Doe & house-17000/-19000/-
Buck Service Centre Feature: Maccha housing flock size: 4 buck Regular vaccination & deworming Natural Insemination once daily Ensure trabis Natural Insemination (NI)charge-100/- Investment (yearly): Housing, Buck, feed & treatment: 50000/--55000/- Income: NI charge- 1,00,000/--1,10,000/- Net profit: 45000/--50000/- (3500/--4000/- monthly) Asset: Buck & house-28,000/-30,000/-
Toward new technology Vermicompost Production (semi-commercial) Feature: • Produced by the worm (cow dung, kitchen waste) • Improves soil organic matter (5%) content • Improves germination rate, crop’s growth & yield • Investment (yearly): • Rings (10 no’s): 2500/- • Vermin (20000 no’s): 20000/- • Cow dung (12000kg): (self) • Sac, sieve, net: 1700/- • Total: 24,200/- • Income: • Vermicompost (4800kg) & • Vermin (80000 no’s): 1,37,600/- • Net profit: • 113400/- (8 batch/year) i.e. or 9450/- monthly • PRIME Intervention • No. of farm established: 18045 • (Small & semi-commercial) • Total investment: 42.8 million • Total Production: 14454 ton/year • Income: 173 million (except vermin)
Quail (layer) Production Feature: • Need Low Investment • Starts laying at six to seven weeks of age • Laying 280 to 295 eggs/year. Investment:Cage, Quail, feed & other: 48,000/- Income:Egg, Quail & other: 67,000/- Net profit:16,000/--18,000/- (one year) Asset:cage & equipment- 5,000/- Rabbit Production Feature: Short gestation period (30-32 days) Give birth 6-8 time per year Addressing the tribe Investment:Cage, rabbit, feed & other: 23,000/- Income: Rabbit: 31,500/- Net return: 7000/--8000/- (7 kitting/year) Asset: Rabbit, cage & equipment- 8,000/-
Mat making • Basket making • Investment • Total investment 20,400.00 BDT (training, equipments, cloth etc.) • Investment • Total investment 5,400.00 BDT (training, materials etc.) • Income • Income 2,600.00-3,200.00 BDT/month • Income • Monthly income 3,500.00-5,500.00 BDT/month
Income • Monthly income 2,000.00-2,500.00 BDT (4 cap/month) • Investment • Total investment 3,000.00 BDT (Training, cloth, thread etc)
Tailoring • Stitching • Investment • Total investment 25,000.00 BDT (training-6months, machine, cloth, etc.) • Investment • Total investment 8,000.00 BDT (training) • Income • Monthly income 2,500.00-3,500.00 BDT • Income • Monthly income 2,500.00-3,000.00 BDT
Mobile Servicing • Hosiery • Investment • Total investment 70,600.00 BDT (training, machine, equipments, computer etc.) • Investment • Total investment 8,140.00 BDT (training) • Income • Monthly income 10,000.00-15,000.00 BDT • Income • Monthly income 6,000.00-10,000.00 BDT
Mechanic • Electrical • Investment • Total investment 30,500/-BDT (training, equipments etc.) • Investment • Total investment 22,600.00 BDT (training) • Income • Monthly income 6,000.00-8000.00 BDT • income • Monthly income 6,000.00-10,000.00 BDT
Education ProgramENRICH • Total Centres- 3239 • Total Students- 86,745 • Each SK has on the average 26 students per centre. • 53% of students are girls. • Low cost: Cost/Centre/Year-Tk. 26,250/- • Ultra-poor and poor students are achieved good results in their school exam. • % of dropped-out: 7% • High appreciation from the society
Moving Forward • Living remains no more a daily struggle • Attaining qualitative economic security. It’s a result of many small qualitative changes in livelihoods • New livelihood strategies have to contribute in increasing the purchasing power of the households • Considering heterogeneity, need further stratification within the extreme poor • Expanding economic opportunities to create ‘livelihood ladders’ • Promoting high earning livelihood strategy • Identifying and exploiting new income generating activities and making markets work for the extreme poor • Growth of homestead economy as a source of cash income • Acquiring new skill to enhance the scale of operation 28
Removing constraints of the bottom poor – Supply Side Issues • Mind-set of development agencies yet to be re-oriented toward addressing the bottom poor. Besides, they are not technically and financially equipped to address the bottom poor issues. Furthermore, they do not have sufficient trained staff to handle the issues of bottom poor. • Absence of targeted, long-term, flexible programme for the bottom-poor • Both government and non-government agencies are shying away from the poor of vulnerable disaster prone areas. 29
Conclusion • PKSF attempts to expand growth-oriented market-based activities for the poorest • Multidimensional aspect of poverty must be addressed • Making sufficient investment for enhancing human and social capital • A more focused and programmatic approach has to be undertaken • Expanding employment opportunities in both formal and informal sector is crucial • Identify and expand market linkages for the poor 30
Thanks 31