Second Exam
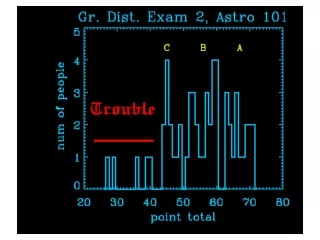
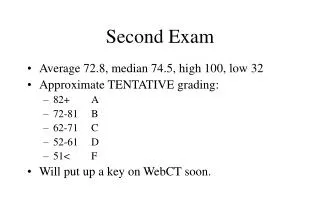
Second Exam. Average 72.8, median 74.5, high 100, low 32 Approximate TENTATIVE grading: 82+ A 72-81 B 62-71 C 52-61 D 51< F Will put up a key on WebCT soon. Check our math!!!. (apparently, getting a Ph.D. doesn’t guarantee that you can add). Review Question. Q.

Second Exam
E N D
Presentation Transcript
Second Exam • Average 72.8, median 74.5, high 100, low 32 • Approximate TENTATIVE grading: • 82+ A • 72-81 B • 62-71 C • 52-61 D • 51< F • Will put up a key on WebCT soon.
Check our math!!! (apparently, getting a Ph.D. doesn’t guarantee that you can add)
Review Question Q. If the air temperature at sea level were 23°C, what would the air temperature be at a height of 2 kilometers under average conditions? A. The environmental lapse rate is 6.5°C per kilometer, which means on average temperature decreases by 6.5°C every 1000 meters, so the answer is 23 – (2x6.5) = 10°C
Review Question Q. Least three basic mechanisms of energy transfer. Which mechanism is least important to meteorology? • A. • Conduction • Convection • Radiation • Conduction
Review Question Q. What are isotherms and what is their purpose? A. Isotherms are lines that connect points of equal temperature, generally trend east to west and show decreasing temperature poleward. Isotherms illustrate latitudinal shifting of temperatures caused by the seasonal migration of the Sun’s vertical rays and also the presence of ocean currents.
Easterly Wave Development cold Canary current kills most disturbances Forecasters look to the west coast of Africa to see the hint of hurricane formation. An easterly wave which lead to Hurricane Bertha
Hurricane Formation and Decay • By WMO agreement, tropical cyclones are given terms which correspond to their strength, as measured by wind speed. • Tropical Depression: sustained winds less than 61 kilometers per hour (37 mph). Given numbers like TD 11. • Tropical Storm: sustained winds are between 61 and 119 kilometers per hour (37 and 74 mph). Tropical storms are given names. • Hurricane: sustained winds are at least 119 kilometers per hour (75 mph)
Hurricane Decay • Because hurricanes are heat enginesfueled by condensation of • water vapor, the loss of water vapor will result in a rapid • decrease in storm strength. In addition, a hurricane needs upper • level support to maintain vertical balance and rapid rotation. • Three events cause hurricanes to lose strength: • move over waters that cannot supply warm, moist tropical air • move onto land • reach a location where the large-scale flow aloft is unfavorable • A hurricane can reinvigorate itself if the the supply of warm, moist • air returns or if upper level conditions once again become conducive • to rapid rotation.
Hurricane Destruction The amount of damage caused by a hurricane is dependent on many things (population, warning time, etc…). The most significant factor is the strength of the storm itself. Saffir-Simpson scale was established to rank the relative intensities of hurricanes (1 least severe- 5 most severe). • Damage caused by hurricanes can be divided into three • classes: • storm surge • wind damage • inland freshwater flooding
Storm Surge Storm surge is a dome of water 65-80 kilometers (40-50 miles) wide that sweeps across the coast near the point where the eye makes land fall. Storm surge is caused by the pileup of water because of strong onshore winds. Stronger to the right of where the eye makes landfall.
Storm Surge Winds are stronger and storm surge is larger on the right side of the storm.
Storm surge was tremendous in The Great Galveston Hurricane of 1900 A typical block in Galveston after the storm The scene at 21st and O Avenue on Sunday morning September 9, 1900 The ruins of St. Patrick's Catholic Church
Wind Damage For higher category hurricanes, wind damage can be a significant destructive force related to hurricanes. Wind damage is typically more widespread than storm surge, but less severe (if the structures in the path of high winds are strong enough to withstand the force of the winds). Flying debris can be a very damaging and dangerous result of strong winds.
Wind Damage Winds associated with a Northern Hemisphere hurricane advancing toward the coast.
Inland Flooding Storm surge and strong winds are typically associated with coastal areas, however, inland flooding can extend hundreds of miles from the coast and several days after the storm has lost its hurricane status (winds <75 mph). Hurricane Agnes was a good example of a hurricane which caused significant inland flooding. While Agnes was only a category 1 storm on the Saffir-Simpson scale more than 2 billion dollars in damage related to the hurricane (most of the severe flooding was in Pennsylvania). It is interesting to note that Agnes was an overall “good thing” economically as farmers in the southeast received much needed rain for crops.
Inland flooding due to hurricanes can be extensive as rainfall from a hurricane sometimes can be measured in tens of inches. Inland flooding due to hurricanes can be extensive as rainfall from a hurricane sometimes can be measured in tens of inches. Note that this is nowhere included in the Saffir-Simpson scale.
Saffir-Simpson scale? • While wind is an important part of a hurricane, rating hurricanes by wind alone is not a good indicator of how much damage the hurricane might do. • Hurricane Mitch was a very strong hurricane, but more importantly, it landed in Central America and did not move, preferring to dump all its rain in one spot!
Detecting and Tracking Hurricanes North Atlantic hurricanes develop in the trade winds which explains why these storms move east to west at ~15 mph. Hurricanes almost always curve poleward and are deflected into the westerlies which increases their forward motion up to a maximum of about 60 mph. However, on a finer scale, all hurricanes have irregular paths, which makes prediction of their movement challenging.
Detecting and Tracking Hurricanes The greatest single advance in tools used for observing tropical cyclones has been the development of meteorological satellites. Satellites allow us to detect tropical storms and have significantly improved monitoring—you can see ‘em days away!
well defined eye Hurricane Allen in 1980 ( a rare category 5 storm)
Aircraft reconnaissance Aircraft reconnaissance represents the second important source of information about hurricanes. Experimental flights were conducted in the 1940’s and will be used for the forseeable future because of the detailed information they provide. Much information of hurricane structure has been obtained by the P3 WP-3A Orions WWII patrol bomber, the PB4Y Privateer Early Aircraft Current Aircraft
Radars and Buoys make up the third and fourth tools used to study and observe hurricanes. A network of radar units in the Gulf of Mexico and Atlantic coastal regions give continuous coverage of tropical storms within 150 miles of the coast. Buoys represent the only means of making nearly continuous direct measurements of surface conditions over the ocean.
Hurricane Watches and Warnings A hurricane watch is an announcement aimed at specific coastal areas that a hurricane poses a possible threat, generally within 36 hours. VERY different from a tornado watch! A hurricane warning is issued when sustained winds of 74 mph or higher are expected within a specified coastal area in 24 hours or less.
NOAA Hurricane site http://www.nhc.noaa.gov/
Hurricane Season • Hurricane season: June 1 – November 30 • When water temperatures near the equator are over 80ºF • Ordinary year: • 9.6 tropical storms A.K.A. “named storms” • 5.9 hurricanes • 2.3 major hurricanes (category 3-4-5)
Upcoming Hurricane Season http://hurricane.atmos.colostate.edu/Forecasts/2003/april2003/ • 12 tropical storms • 8 hurricanes • 3 major storms
1950-2000 Averages • 1) Named Storms (NS) 9.6 • 2) Named Storm Days (NSD) 49.1 • 3) Hurricanes (H) 5.9 • 4) Hurricane Days (HD) 24.5 • 5) Intense Hurricanes (IH) 2.3 • 6) Intense Hurricane Days (IHD) 5.0
This year… • The recent upturn in Atlantic basin hurricane activity which began in 1995 is expected to continue through 2003. We anticipate an above-average probability for Atlantic basin tropical cyclones and U.S. hurricane landfall.
Predictors ALL above normal • Azores high is weaker than usual, meaning higher water temperatures than usual • Other indicators point to a shift from El Nino to La Nina conditions, and warmer Atlantic temperatures in general.
Similar seasons • “There were four hurricane seasons since 1949 with characteristics similar to what we have observed through March 2003 and what we anticipate will occur in the summer/fall 2003 period. These best years are 1952, 1954, 1958 and 1998. We expect that the 2003 seasonal hurricane conditions will be slightly above the average values for these four years.”
Global Warming? • “Various groups and individuals have suggested that the recent large upswing in Atlantic hurricane activity (since 1995) may be in some way related to the effects of increased man-made greenhouse gases such as carbon dioxide (CO2). There is no reasonable scientific way that such an interpretation of this recent upward shift in Atlantic hurricane activity can be made.”
…and now the bad news • "A remarkable upturn in Atlantic Basin hurricane activity has occurred the past seven years," Gray said. "We believe we have entered a new, multi-decadal era for increased storm activity, particularly an increase in the number of major hurricanes, which will likely last another two or three decades."
…no wait, there’s more… • Beyond the past seven years, the United States also has seen a significant decrease in major hurricane landfalls over the past three-and-a-half decades. According to Gray, this pattern has resulted from a rare combination of multi-decadal global circulation changes and pure luck and cannot be expected to continue.
…oh yeah, one more. • "We should anticipate the century-long landfall climatology to eventually right itself and must expect a large increase in landfalling hurricanes in the coming years," Gray said. "With exploding growth in coastal populations and property values, we must be prepared for levels of hurricane damage many, many times greater than has occurred in the past three decades." (ouch)
Next week • Hurricane primer handout