Download
1 / 1
10 likes | 62 Vues
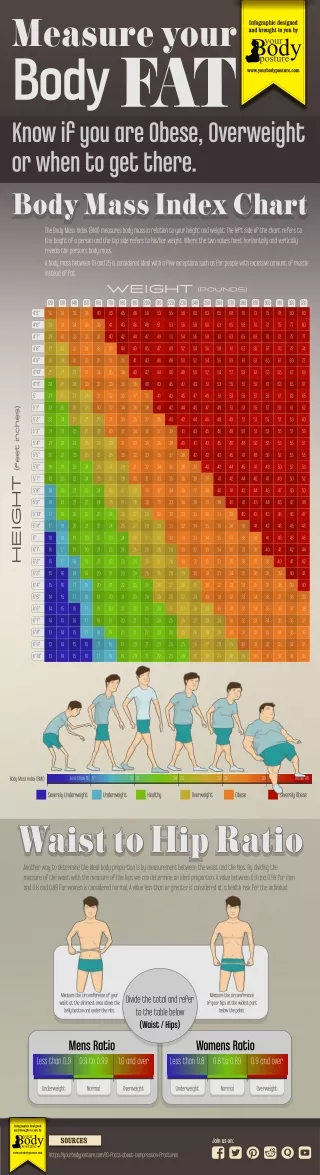
Know if you are Obese, Overweight or when to get there with the help of this Body Mass Index Chart.

E N D
Measure your BodyFAT Know if you are Obese, Overweight or when to get there. Infographic designed and brought to you by www.yourbodyposture.com Body Mass Index Chart Body Mass Index Chart Body Mass Index Chart The Body Mass Index (BMI) measures body mass in relation to your height and weight. The left side of the chart refers to the height of a person and the top side refers to his/her weight. Where the two values meet horizontally and vertically reveals the person's body mass. A body mass between 19 and 25 is considered ideal with a few exceptions such as for people with excessive amount of muscle instead of fat. WEIGHT (POUNDS) 120 130 140 150 160 170 180 190 200 210 220 230 240 250 260 270 280 290 300 310 320 330 4’ 5” 30 33 35 38 40 43 45 48 50 53 55 58 60 63 65 68 70 73 75 78 80 83 4’ 6” 29 31 34 36 39 41 43 46 48 51 53 56 58 60 63 65 68 70 72 75 77 80 4’ 7” 28 30 33 35 37 40 42 44 47 49 51 54 56 58 61 63 65 68 70 72 75 77 4’ 8” 27 29 31 34 36 38 40 43 45 47 49 52 54 56 58 61 63 65 67 70 72 74 4’ 9” 26 28 30 33 35 37 39 41 43 46 48 50 52 54 56 59 61 63 65 67 69 72 4’ 10” 25 27 29 31 34 36 38 40 42 44 46 48 50 52 54 57 59 61 63 65 67 69 4’ 11” 24 26 28 30 32 33 36 38 40 43 45 47 49 51 53 55 57 59 61 63 65 67 5’ 23 25 27 29 31 32 35 37 39 41 43 45 47 49 51 53 55 57 59 61 63 65 5’ 1” 23 25 26 28 30 32 34 36 38 40 42 44 45 47 49 51 53 55 57 59 61 62 HEIGHT (feet inches) 5’ 2” 22 24 25 27 29 31 33 35 37 38 40 42 44 46 48 49 51 53 55 57 59 60 5’ 3” 21 23 25 27 28 30 32 34 36 37 39 41 43 45 46 48 50 51 53 55 57 59 5’ 4” 28 29 31 33 34 36 38 40 41 43 45 46 48 50 52 53 55 57 21 22 24 26 5’ 5” 20 22 23 25 27 28 30 32 33 35 37 38 42 42 43 45 47 48 50 52 53 55 5’ 6” 19 21 23 24 26 27 29 31 32 34 36 38 39 40 42 44 45 47 49 50 52 53 5’ 7” 19 20 22 24 25 27 28 30 31 33 35 36 38 39 41 42 44 46 47 49 50 52 5’ 8” 18 20 21 23 24 26 27 29 30 32 34 35 37 38 40 41 43 44 46 47 49 50 5’ 9” 18 19 21 22 24 25 27 28 30 31 33 34 36 37 38 40 41 43 44 46 47 49 5’ 10” 17 19 20 22 23 24 26 27 29 30 32 33 35 36 37 39 40 42 43 45 46 47 5’ 11” 17 18 20 21 22 24 25 27 28 29 31 32 34 35 36 38 39 41 42 43 45 45 6’ 16 18 19 20 22 23 24 26 27 29 30 31 33 34 35 37 38 39 41 43 43 45 6’ 1” 16 17 19 20 21 22 24 25 26 28 29 30 32 33 34 36 37 38 40 41 42 44 6’ 2” 15 17 18 19 21 22 23 24 26 27 28 30 31 32 33 35 36 37 39 40 41 42 6’ 3” 15 16 18 19 20 21 23 24 25 26 28 29 30 31 33 34 35 36 38 39 40 41 6’ 4” 15 16 17 18 20 21 22 23 24 26 27 28 29 30 32 33 34 35 37 38 39 40 6’ 5” 14 15 17 18 19 20 21 23 24 25 26 27 29 30 31 32 33 34 36 37 38 39 6’ 6” 14 15 16 17 19 20 21 22 23 24 25 27 28 29 30 31 32 34 35 36 37 38 6’ 7” 14 15 16 17 18 19 20 21 23 24 25 26 27 28 29 30 32 33 34 35 36 37 6’ 8” 13 14 15 17 18 19 20 21 22 23 24 25 26 28 29 30 31 32 33 34 35 36 6’ 9” 13 14 15 16 17 18 19 20 21 23 24 25 26 27 28 29 30 31 32 33 34 35 6’ 10” 13 14 15 16 17 18 19 20 21 22 23 24 25 26 27 28 29 30 31 32 34 35 Less than 16 17 18 19 24 25 29 30 39 Above 40 Body Mass Index (BMI) Severely Underweight Underweight Healthy Overweight Obese Severely Obese Waist to Hip Ratio Waist to Hip Ratio Waist to Hip Ratio Another way to determine the ideal body proportion is by measurement between the waist and the hips. By dividing the measure of the waist with the measure of the hips we can determine an ideal proportion. A value between 0.9 and 0.99 for men and 0.8 and 0.89 for women is considered normal. A value less than or greater is considered at a health risk for the individual. Measure the circumference of your waist at the slimmest area above the belly button and under the ribs. Measure the circumference of your hips at the widest part below the pelvis. Divide the total and refer to the table below (Waist / Hips) Mens Ratio 0.9 to 0.99 Womens Ratio Less than 0.8 Less than 0.9 1.0 and over 0.8 to 0.89 0.9 and over Underweight Normal Overweight Underweight Normal Overweight Infographic designed and brought to you by SOURCES Join us on: www.yourbodyposture.com https://yourbodyposture.com/10-facts-about-compression-fractures