Integrating Genomic Databases
Learn about integrating biological data sources, types, and technologies, and the importance of data integration in disease treatment development. Explore warehouse and federation approaches, GUS/RAD warehouse model, and different technologies for data integration.

Integrating Genomic Databases
E N D
Presentation Transcript
Integrating Genomic Databases Chris Stoeckert, Ph.D. Computational Biology and Informatics Laboratory
Talk Outline • Challenge of integrating biological data • Federations vs warehouses • GUS/RAD - warehouse approach • K2 - connecting to other systems
Challenge of Integrating Biological Data • Many sources of different types • Different types of data • Biological sequence (DNA, RNA, protein) • Gene expression • Structure • Etc… • Different representations of data • Flat file • Relational • Object-oriented • Etc… • Imposing semantics of biology • Genes and RNAs and Proteins are related • But may have different names • Biology is context dependent
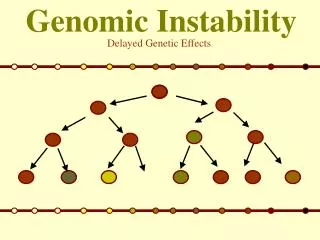
Disease Treatment Devel. Stage Anatomy Sample Label ExperimentSample Taxon Exp.ControlGenes Hybridization Conditions Experiment ControlGenes Groups ExpGroups Examples of Different Sources and Types
Why Bother to Integrate? Remember the fable of the blind men and the elephant! http://www.noogenesis.com/pineapple/blind_men_elephant.html
Federations vs Warehouses • Federations • Link to everybody • Always current • Generally stuck with data as is • Warehouses • Bring everything in house • Can cleanse and add value to integrated data • Staying up to date Davidson et al. IBM Systems Journal 2001
GUS/RAD - Warehouse Approach • Gene Discovery • EST analysis • Genomic sequence analysis • Gene Regulation • Microarray analysis • Promoter/ regulatory region analysis • Biological data representation • Data integration • Ontology
Computational Biology and Informatics LaboratoryOctober, 2001
Controlled vocabs. free text • GO • Species • Tissue • Dev. Stage under development GUS: Genomics Unified Schema • Genes, gene models • STSs, repeats, etc • Cross-species analysis Genomic Sequence RAD RNA Abundance DB • Characterize transcripts • RH mapping • Library analysis • Cross-species analysis • DOTS Transcribed Sequence Special Features • Arrays • SAGE • Conditions Transcript Expression • Ownership • Protection • Algorithm • Evidence • Similarity • Versioning • Domains • Function • Structure • Cross-species analysis Protein Sequence Pathways Networks • Representation • Reconstruction
Experiment Raw Data Platform Metadata Processed Data Algorithm RAD: RNA Abundance Database Compliant with the MGED standards
Clusters vs. Contig Assemblies UniGene Transcribed Sequences (DOTS) CAP4: (Paracel) -Consensus Sequences -Alternative splicing -Paralogs BLAST: Clusters of ESTs & mRNAs
Bridging Fingerprint Contigs and RH Maps on Mouse Chromosome 5 Crabtree et al. Genome Research 2001 Fingerprint Map Chr. 5 RH Map
Identify shared TF binding sites Genomic alignment and comparative Sequence analysis TESS (Transcription Element Search Software) PROM-REC (Promoter recognition) RAD GUS EST clustering and assembly
Assembled Transcripts About 3 million human EST and mRNA sequences used Combined into 797,028assemblies Cluster into 150,006 “genes” Can identify a protein for 76,771 genes And predict a function for 24,127 genes About 2 million mouse EST and mRNA sequences used Combined into 355,770 assemblies Cluster into 74,024 “genes” Can identify a protein for 34,008 genes And predict a function for 15,403 genes
CBIL Project Architecture Sequence & annotation Gene index (ESTs and mRNAs) Microarray expression data experimental annotation Relational DB (Oracle) with Perl object layer GUS RAD
Linking GUS to Other Sources GUS Neurocartographer K2 Medline What papers have been published on genes that are expressed in this part of the brain?
CBIL: Chris Stoeckert Vladimir Babenko Brian Brunk Jonathan Crabtree Sharon Diskin Greg Grant Yuri Kondrakhin Georgi Kostov Phil Le Li Li Junmin Liu Elisabetta Manduchi Joan Mazzarelli Shannon McWeeney Debbie Pinney Angel Pizarro Jonathan Schug PlasmoDB collaborators: David Roos Martin Fraunholz Jesse Kissinger Jules Milgram Ross Koppel, Monash U. Malarial Genome Sequencing Consortium (Sanger Centre, Stanford U., TIGR/NMRC) EPConDB collaborators: Klaus Kaestner Marie Scearce Doug Melton, Harvard Alan Permutt, Wash. U Comparative Sequence Analysis Collaborators: Maja Bucan Shaying Zhao Whitehead/MIT Center for Genome Research K2/DARPA: Sue Davidson Scott Harker Jonathan Nissanov Carl Gustafson Acknowledgements http://www.cbil.upenn.edu