CAP Dashboard Scorecard pg.1
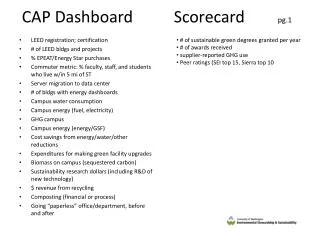
CAP Dashboard Scorecard pg.1. # of sustainable green degrees granted per year # of awards received supplier-reported GHG use Peer ratings (SEI top 15, Sierra top 10. LEED registration; certification # of LEED bldgs and projects % EPEAT/Energy Star purchases

CAP Dashboard Scorecard pg.1
E N D
Presentation Transcript
CAP Dashboard Scorecard pg.1 • # of sustainable green degrees granted per year • # of awards received • supplier-reported GHG use • Peer ratings (SEI top 15, Sierra top 10 • LEED registration; certification • # of LEED bldgs and projects • % EPEAT/Energy Star purchases • Commuter metric: % faculty, staff, and students who live w/in 5 mi of ST • Server migration to data center • # of bldgs with energy dashboards • Campus water consumption • Campus energy (fuel, electricity) • GHG campus • Campus energy (energy/GSF) • Cost savings from energy/water/other reductions • Expenditures for making green facility upgrades • Biomass on campus (sequestered carbon) • Sustainability research dollars (including R&D of new technology) • $ revenue from recycling • Composting (financial or process) • Going “paperless” office/department, before and after
CAP Dashboard pg.2 • Increase of student enrollment in COENV • Track contributions to green fund • F2 education of other staff, faculty, students • # of campus green groups • # of green RSOs • UWESS website traffic • Hits to ESS/ESAC/COE websites • # of UW Sustainability pledge participants; % increase • Commuting mode/percentages • # of joint projects with F2 and environmental curriculum (need more discussion) • Dollars spent by buying local