Central America Rainfall Trend Analysis (2009)
250 likes | 326 Vues
Explore rainfall trends in Central America from 1970 to 2004, analyzing annual and seasonal patterns, water deficiency/excess frequencies, and geographic locations. The study reveals varying trends and anomalies across different regions, shedding light on potential drought indicators.

Central America Rainfall Trend Analysis (2009)
E N D
Presentation Transcript
Trend Analysis for Central America Diego Pedreros Greg Husak Oct, 2009
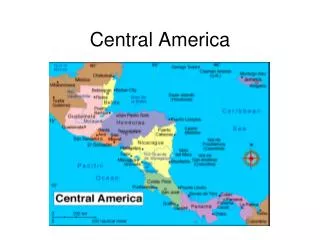
Introduction Rainfall in Central America varies from 500 to 5000 mm at year distributed in two main seasons in the Pacific slope of the region and a single season in the Caribbean. The following slides show the annual and seasonal trends that rainfall presents during the period 1970 to 2004. Also, a frequency of water deficiency /excess is calculated.
Methods Rainfall trends were calculated by correlating annual totals with the 35 years of data. The P-value was obtained to determine the strength of the relationship. A line was fitted and the slope of the line was mapped to determine the amount of change, in mm by year. The trend was obtained for annual, primera and postrera season. To determine the frequency of rainfall deficiencies or excess, a percent anomaly was calculated for each period, by pixel. Below 85% of normal was assumed to be deficient rainfall and above 115% was assumed to be excess. Once the % anomaly was obtained for each year, a map of the number of times a pixel was deficient / excess was created.
Rainfall Annual Trend P-val Latitude Longitude The P-value shows the probability of the relationship being random. Areas where P-value is less than 0.05 indicate non-random relationships.
Rainfall Annual Trend Estimated change, mm per year Latitude Longitude The slope of the line shows the amount of change in rainfall per year. The red colors show a decrease in rainfall while the blue shows an increase. It is important to check the areas where the P-value is low to better interpret this graph.
Rainfall Trend, Season MJJ P-val Latitude Longitude
Rainfall Trend, Season MJJ Estimated change in mm per year Latitude Longitude
Rainfall Trend, Season ASO P-value, ASO Latitude Longitude
Rainfall Trend, Season ASO Estimated change, mm per year Latitude Longitude
Frequency of Water Deficit, Annual Number of Times below 85% of normal Latitude Longitude
Frequency of Water Excess, Annual Number of Times above 115% of normal Latitude Longitude
Frequency of Water Deficit, May-Jun-Jul Number of Times below 85% of normal Latitude Longitude
Frequency of Water Excess, May-June-July Number of Times above 115% of normal Latitude Longitude
Frequency of Water Deficit, Aug-Sep-Oct Number of Times below 85% of normal Latitude Longitude
Frequency of Water Excess, Aug-Sep-Oct Number of Times above 115% of normal Latitude Longitude
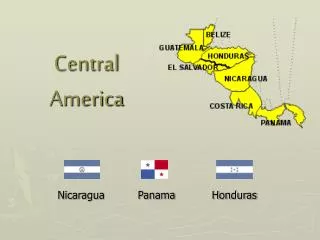
Conclusions • This study shows that at the annual scale rainfall in central America presents a positive trend in most of the Caribbean and part of the Pacific of Costa Rica while the rest of the region shows no trend. Looking in more detail it seem that rainfall is increasing during the period MJJ and no so much during ASO. • As for the frequency of rainfall deficiency and excess, the regions that show the most effect is the pacific slopes of Nicaragua and the western part of the Caribbean coast of Honduras. Slides 13 and 15 show that the major effect is during the Agust-October period with less extent in the May-July period.
Disclaimer only the station data for Guatemala an a few station in the rest of the region have been validated by the Meteorological services. These results should not be used for local analysis.