Retail Capital Markets
140 likes | 277 Vues
Retail Capital Markets. August 2011. Employment (16+ years of age, millions). Labor Participation Rate. While many focus on the unemployment rate for retail sales, the more important metrics are simply the number of people employed and the overall participation rate.

Retail Capital Markets
E N D
Presentation Transcript
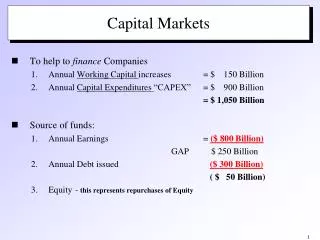
Retail Capital Markets August 2011
Employment (16+ years of age, millions) Labor Participation Rate • While many focus on the unemployment rate for retail sales, the more important metrics are simply the number of people employed and the overall participation rate. • The fact that retail fundamentals are as strong as they are is astounding in light of these two metrics. Updated September 7th , 2011
Zero net new jobs since Jan-00 +7.7 million 2004-2007 -6.7 million since Dec-07 Unemployment Rate Monthly Change in Nonfarm Payroll Employment (000’s) Updated September 7th , 2011
Retail Sales Growth - Monthly (Excl. Auto) Retail Sales Growth - Monthly (Excl. Auto & Gas) Monthly Retail Sales (Excl. Auto, in $ billions) • Net worth back to 2003 levels • Sales growth has clearly come off the bottom • In fact, it’s back to its all time peak! Updated Sept.14th, 2011
Debt Outstanding ($ trillions) Net Worth ($ in trillions) Updated July 14th 2011
Consumer Confidence 16 months 8 months 8 months 24 months 6 months U.S. Recessions Updated September 7th , 2011
Retail Sales might be at ’06 levels, but supply is 13% higher Retail GLA Deliveries (Millions) 73.8 49.3 44.0 38.6 36.0 33.9 33.8 31.2 22.8 20.1 16.9 12.3 9.2 10.7 6.9 7.2 6.4 Updated July 14th, 2011
Snapshot of Retail CMBS Loans by Maturity Year “California Here We Come…” Current Balance (in Billions) CATX NY FL AZ CA NY FL TX IL CA FL TX NJ NY CA TX FL NY NV CA FL TX NY GA HI CA TX NY IN CA FL TX AZ NY CA TX FL NY PA Top-5 States (36% - 50% of Total) Note: Interest Only includes loans that are interest only through entire term Updated June 6th, 2011
National Retailers Expanding in 2011 • 86 retailers planning to open 2 or more stores in 2011 • 60 retailers planning to open 20 or more stores in 2011 • 27 retailers planning to open 100 or more stores in 2011 Select Retailer Store Openings in 2011 Updated June 2011
Positive YOY Growth Negative YOY Growth Recent Same-Store Sales Growth By Category Home Décor/ Improvement Jewelry Office Supply Books Wholesale Electronics Hobby / Salon / Pet Department Specialty Apparel Grocery Discount Drug Note: Sales reflect most recently-reported quarterly comparable sales growth Updated August 17th 2011
Positive YOY Growth Negative YOY Growth Recent Same-Store Sales Growth By Primary Outlet Lifestyle Power Neighborhood Malls Note: Sales reflect most recently-reported quarterly comparable sales growth Updated August 17rd 2011
A Tale of Two Markets GREEN LIGHT Grocery-Anchored!!! Or Strong Credit Flight to Safety Major Markets All Cash or Portfolio Lenders RED LIGHT Second Tier Tenants Or Lifestyle Centers High Occupancy Costs / Smaller Markets Everything Else CMBS Quality Assets If “B” Quality, REO assets / non-performing loans get Substantially more interest and higher pricing Bargains? Updated November 2010
Recent Sales / Underwriting • Camp Creek Marketplace (East Point, GA) • Anchors: Lowe’s (NAP), Target (NAP), Marshalls, Ross, TJX, Barnes & Noble, Staples, PetSmart • 97% Occupancy • 6.95% Capitalization Rate, All Cash Sale • Crabapple and Saddlebrook Shopping Centers (Milton / Alpharetta, GA) • Both Kroger Anchored (Sales of $360 to $460 psf) • 94% & 98% Occupancy • Blended Capitalization Rate of 5.9%. Unleveraged IRR of 7% Using a 6.5% Residual. • Edgewood Retail District (Atlanta, GA) • Target (NAP), Kroger, Best Buy, Bed Bath & Beyond, Ross Dress for Less • 97% Occupancy • 6.7% Capitalization Rate, Buyer Assumed High LTV Note with High Coupon. Defeasance Would be Approximately $6M. • Noteworthy Sales Around the USA • The Forum at Carlsbad (CA) – 4.7% cap; Village at Waugh Chapel (DC) – 6.9% cap, but has dilutive debt; DC Portfolio Under Contract at 5.6% cap Source: The Nielsen Company Updated May 17th 2010