Download
1 / 22
220 likes | 452 Vues
Cinzia Di Palo* Assistant Professor PhD, University of Cassino and Southern Lazio * Corresponding author: c.dipalo@unicas.it Anna Maria Palazzo Assistant Professor, University of Cassino and Southern Lazio. Massimo Angrisani Full Professor, Sapienza University of Rome

E N D
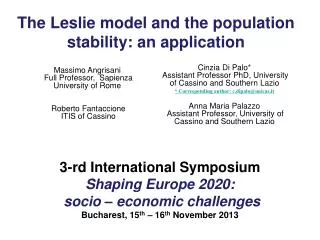
Cinzia Di Palo* Assistant Professor PhD, University of Cassino and Southern Lazio * Corresponding author: c.dipalo@unicas.it Anna Maria Palazzo Assistant Professor, University of Cassino and Southern Lazio Massimo Angrisani Full Professor, Sapienza University of Rome Roberto Fantaccione ITIS of Cassino The Leslie model and the population stability: an application 3-rd International Symposium Shaping Europe 2020: socio – economic challenges Bucharest, 15th – 16th November 2013
Population ageing and stability Decreasing fertility and longer life expectancy redraw the age structure of the population as they involve the increase of the relative weight of the older age groups with respect to the total population. With specific regard to many European countries, which currently experience low rates of mortality up to advanced adult ages and persistent low rates of fertility, the observed or projected decline in the population is considered one of the main challenges to long-term social and economic sustainability of social security schemes, particularly those pay-as-you-go financed. This is even more emphasised by the current economic crisis that puts a further increasing pressure on economic systems and negatively impacts on public finances. SHAPING EUROPE 2020: SOCIO-ECONOMIC CHALLENGES 15 -16 November 2013
Population ageing and stability In order to better understand at which extent the socio-economic challenge of the population ageing affects sustainability of pay-as-you-go social security schemes, it is appropriate to analyse the current and projected dynamics of the population and its distribution by age, whose changes depend on the trends in three key factors: fertility rates, survival probabilities, and net migration inflows. SHAPING EUROPE 2020: SOCIO-ECONOMIC CHALLENGES 15 -16 November 2013
Study objectives The main goal of this paper consists in analysing the issue of population stability. We aim to understand if the population tends to stabilise under current fertility rates and survival probabilities, namely if the size and the percentage distribution by age of the population stabilise. We neglect the effects of migration ” …Numerous studies have shown that the numbers of migrants must be very large to have an appreciable effect on population aging…”, (National Research Council, 2001, p. 44). We apply the population projection model of Leslie (1945) in a form different from the classical method as it considers the population divided into sexes, “….as in Angrisani, Attias, Bianchi and Varga (2004) Demographic dynamics for the pay-as-you-go pensions system. Pure Mathematics and Applications. We consider four European countries, which are Germany, Italy, Spain and Sweden, and Japan that represents the most long-lived country, according to the OECD (2013, Life expectancy at birth, total population 2013/2). SHAPING EUROPE 2020: SOCIO-ECONOMIC CHALLENGES 15 -16 November 2013
Application of the Leslie model In the Leslie model, age-specific mortality and fertility rates are used to model the dynamics of population age structure. Both time and age are discrete variables defined on yearly bases. We suppose that the individuals of a population are categorised into a finite number of age classes. Let N-1 be the maximum attainable age by an individual being alive whatever the belonging sex is, namely no individual is alive at age N. We consider the population separated in the two sex and grouped in N age classes for i=0,1,2…N-1. SHAPING EUROPE 2020: SOCIO-ECONOMIC CHALLENGES 15 -16 November 2013
Application of the Leslie model In the following, let us denote with: SHAPING EUROPE 2020: SOCIO-ECONOMIC CHALLENGES 15 -15 November 2013
Application of the Leslie model SHAPING EUROPE 2020: SOCIO-ECONOMIC CHALLENGES 15 -16 November 2013
Application of the model Leslie SHAPING EUROPE 2020: SOCIO-ECONOMIC CHALLENGES 15 -16 November 2013
Application of the Leslie model SHAPING EUROPE 2020: SOCIO-ECONOMIC CHALLENGES 15 -16 November 2013
Application of the Leslie model SHAPING EUROPE 2020: SOCIO-ECONOMIC CHALLENGES 15 -16 November 2013
Application of the Leslie model By (1), it follows that for large values of t the population vector is proportional to the nonnegative eigenvector associated with the positive eigenvalue . Consequently the proportion of individuals in each class of age with respect to the total population tends to value of the ratio of the corresponding component of eigenvector and the sum of all components of the same eigenvector. SHAPING EUROPE 2020: SOCIO-ECONOMIC CHALLENGES 15 -16 November 2013
Application of the Leslie model We calculate the value of the dominant eigenvalue evaluating the tendential value of the ratio between the values of the population in two consecutive years. With regard to the size, results of our calculations show that each examined population declines according to a yearly factor of decrease that tends to the dominant eigenvalue of the reduced female Leslie matrix. This eigenvalue is less than one for each considered population. Otherwise, consistently with the Leslie theory, the percentage distribution by age tends to stabilise for each considered population. Both phenomena are numerically illustrated in the following Figures 1(a) and 1(b), respectively. SHAPING EUROPE 2020: SOCIO-ECONOMIC CHALLENGES 15 -16 November 2013
Application of the Leslie model We rely on data for year 2008 available from: • Human Mortality Database (HMD) for population and mortality (http://www.mortality.org, data downloaded on July 2013) • Eurostat Database for fertility rates (http://appsso.eurostat.ec.europa.eu, downloaded data in July 2013) for the European countries. • Human Fertility Database (HFD) (http://www.humanfertility.org, data downloaded on July, 2013) for Japan. SHAPING EUROPE 2020: SOCIO-ECONOMIC CHALLENGES 15 -16 November 2013
Trends of the total population and the age distribution of population by percentage SHAPING EUROPE 2020: SOCIO-ECONOMIC CHALLENGES 15 -16 November 2013
Trends of the total population and the age distribution of population by percentage SHAPING EUROPE 2020: SOCIO-ECONOMIC CHALLENGES 15 -16 November 2013
Trends of the total population and the age distribution of population by percentage SHAPING EUROPE 2020: SOCIO-ECONOMIC CHALLENGES 15 -16 November 2013
The criterion of Brauer-Solow For each considered population, the dominant eigenvalue is less than one. This result is consistent with another statement of the Perron-Frobenius theorem for nonnegative and irreducible matrices, known as the “criterion of Brauer-Solow”, that is where is the ithraw of the Leslie reduced female matrix and It follows that necessary condition to the dominant eigenvalue is greater than or equal to one is that the sum of the female per capita birth rates is greater than or equal to one. In fact, for each other raw of the Leslie reduced female matrix the sum of the entries is equal to a survival probability and therefore it is less than one. SHAPING EUROPE 2020: SOCIO-ECONOMIC CHALLENGES 15 -16 November 2013 17
The criterion of Brauer-Solow Since the sum of the female per capita birth rates is less than one under the current fertility rates, we ask by the question on the rate of increase in fertility rates at all ages in the female Leslie matrix so that the dominant eigenvalue is equal to one. In this occurrence, the population tends to stabilise in size in addition to its percentage distribution by age. This phenomenon is illustrated in the following graphs where the size of each considered population by age stabilises and, hence, the percentage distribution by age stabilises. We have to observe the change in the age structure of population that experiences the growth in the relative “weight” of the younger classes of age with respect to the older ones. In the calculation, we suppose that the female per capita birth rates change by a constant proportion at all ages, so that the adjusted female birth rates are given by where k is a constant determined so that the dominant eigenvalue differs from one with an absolute error lower than 10-8. SHAPING EUROPE 2020: SOCIO-ECONOMIC CHALLENGES 15 -16 November 2013 18
Trends of the total population by age under adjustment in fertility rates SHAPING EUROPE 2020: SOCIO-ECONOMIC CHALLENGES 15 -16 November 2013
Trends of the total population by age under adjustment in fertility rates SHAPING EUROPE 2020: SOCIO-ECONOMIC CHALLENGES 15 -16 November 2013
Conclusions We applied the Leslie model in the different form that considers the population divided into sexes, as in Angrisani et al. (2004), using the current values of fertility rates and survival probabilities of some countries at high socio-economic development and high life expectancy. Our analysis confirmed that the considered populations numerically decline according to the value of the Leslie dominant eigenvalue, which results lower than one for each country, while the percentage distribution of population by age stabilises as it is expected by the Perron-Frobenius theory. In this stabilisation, we observe the high relative weight of the elderly with respect to the young population. Moreover, with regard to the issue of the population stability, we have numerically evaluated the rate of adjustment of the fertility rates at all ages so that the dominant eigenvalue is equal to one, namely so that the population stabilises in the size besides in the percentage distribution by age. By means of this adjustment, we obtain the realignment of the ratio of the elderly to the young population on lower values. SHAPING EUROPE 2020: SOCIO-ECONOMIC CHALLENGES 15 -16 November 2013
Thank you for the attention! c.dipalo@unicas.it SHAPING EUROPE 2020: SOCIO-ECONOMIC CHALLENGES 15 -16 November 2013