Download
1 / 24
260 likes | 486 Vues
The Vocational Training System in the United States. Thomas Bailey Community College Research Center Teachers College, Columbia University And Peter Berg School of Labor and Industrial Relations Michigan State University. Outline.

E N D
The Vocational Training System in the United States Thomas Bailey Community College Research Center Teachers College, Columbia University And Peter Berg School of Labor and Industrial Relations Michigan State University
Outline • Structure of the post secondary education system in the United States • Characteristics of the vocational education student population • Connection of vocational education to the labor market • Weakening distinction between general and vocational education • Issues in vocational education
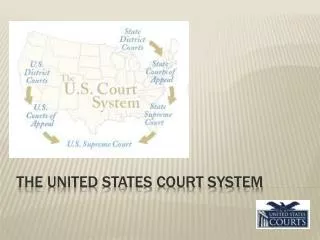
Structure of Post Secondary (PS) Educational Options High School Academic/Vocational 4-Year Univ. Public 4-Year Univ. Private 2-Year Com. Coll. Public 4-Year Univ. Public 2-Year Trade School, for profit 2-Year Com. Coll. Public 4-Year College, for profit 4-Year College, for profit Apprenticeship Non-Credit instruction
Providers of Non-Credit Job-Related Education (1999) Source: NHES99
Fall Headcount: 1970 to 2000 7,000,000 Public four-year 6,000,000 5,000,000 Public two-year 4,000,000 Private four-year 3,000,000 2,000,000 1,000,000 Private two-year 0 1970- 1972- 1974- 1976- 1978- 1980- 1982- 1984- 1986- 1988- 1990- 1992- 1994- 1996- 1998- 2000- 71 73 75 77 79 81 83 85 87 89 91 93 95 97 99 01 Source: U.S. Department of Education. (2002). Digest of Education Statistics.
To Which Field of Study? Source: BPS89.
Current Fund Expenditures (per student, 1995-96) Source: U.S. Department of Education. (2002). Digest of Education Statistics.
States with the Largest and Smallest Two-Year Enrollment (Fall 2000) Five states with most CC students Public Ratio of two-year Four-year Two-year to four-year 1) California 551,871 1,375,900 2.49 2) Texas 436,530 460,004 1.05 3) Illinois 193,783 340,372 1.76 4) Florida 238,189 318,723 1.34 5) New York 336,003 247,414 0.74 Five states with fewest CC students Public Ratio of two-year Four-year Two-year to four-year 46) West Virginia 69,967 6,169 0.09 47) Montana 32,059 5,328 0.17 48) South Dakota 29,882 4,975 0.17 49) Vermont 15,609 4,412 0.28 50) Alaska 25,396 1,163 0.05 Source: U.S. Department of Education. (2002). Digest of Education Statistics.
Summary • CCs account for 40-50 percent of PS enrollments • CCs have much lower costs and much lower tuition • The majority of students in community colleges are in occupational programs • Structure of PS sector varies by state
Characteristics of the Vocational Education Student Population
High School Completion and Initial Postsecondary EnrollmentEighth Graders in 1988
High School Completion and Initial Postsecondary Education by SES QuartileEighth Graders in 1988
Community Colleges and AccessCompared to Students in BA Programs
Connection of Vocational Education to the Labor Market • Weak relationship between specific educational credentials and specific jobs. • Employers involved in designing curricula at community colleges. Many courses taught by past practitioners. Employers serve on community college advisory boards. • Labor Union involvement varies by state. More involvement where unions are strong. • Varied economic value to vocational education
Economic Outcomes by Degree Source: NELS.
Economic Value of a Community College Education • Benefits of an Associate Degree (compared to a HS degree) • Men earn 15 to 30 percent more • Women earn up to 50 percent more • Certificates • Positive for women • Uncertain for men • Earnings benefit of an associate degree is at least half of the benefit of a BA
Summary of Economic Value • AAs and BAs have economic value • CC education, on a per year or per course basis, has as high a payoff as BA education (at least so far) • Certificates have uncertain value and rarely serve as lower rungs of educational ladders • Education without degrees has value, but degrees have more value
Blurring of the Lines between Vocational and General Education • Traditionally, distinction made by type of degree, not preparing students for work. • Many occupational degrees have counterparts in general education system. • Nursing, IT, engineering, accounting • 4-Year universities are increasingly occupational. • BA’s in business, education, health
Blurring of the Lines between Vocational and General Education • Efforts to increase transfers to general education have met with limited success • Non-credit instruction (further training) occurring across all post-secondary institutions.
Issues in Vocational Education • Transferability and achieving a degree or certification • Equity
CC First PSE Students in Various GroupsPercent Distribution by Highest Outcome in All PSE within Eight Years (NELS)
Equity • CC education has value, especially if students earn degrees • Many still don’t have access even to CCs • Many, almost a majority, do not earn any degrees • Access and success are both highly related to income.
Conclusion • Vocational Education System is undergoing change • Rising education requirements • Increasing academic content of vocational work • More non-traditional pathways through college • Concerns about equity and opportunity • Distinctions between vocational education and general education, between initial and further training are becoming blurred. • Efforts to build a system to prepare students for work and subsequent education are far from realized • Race and class still matter